With great disruption came great mobility, as workers scattered across the country during the pandemic. The proliferation of remote work at the beginning of 2020 catalyzed a cascade of changes, from where people chose to live to how they wanted to work. Many took advantage of the newfound flexibility to move out of big cities, trading downtown digs for vaster expanses. Now, as companies settle into the new normal, technology workers in particular are returning to industry hubs. But people still want the option to spend some days away from the office.
While Florida is the most moved-to state overall, Austin, Texas, leads among metropolitan areas as the most popular destination, based on LinkedIn members changing their profile locations. People seem to love Texas’s capital city: According to data from the LinkedIn Economic Graph Workforce Reports , which capture when members change the location in their profiles, it was the metro area that gained the most people during the 12 months ending in October 2022, for the fifth year in a row. It’s an enduring trend—Americans keep moving to Austin.
“Austin has emerged as a hub for tech talent, with more open space, no income taxes, and greater affordability—although less so recently—than the traditional tech cities,” says Brian Xu, a data scientist at LinkedIn. “The pandemic made these qualities more desirable as workers were able to work remotely.”
A newcomer on the October list? The San Francisco Bay Area, with a net migration rate of 55 per 10,000 LinkedIn members, the first time it has made the list since February 2017. (And the November 2022 report shows the same trend.)
Technology Workers Are Returning to San Francisco
In the 12 months that ended in July, San Francisco showed a 48 percent year-over-year increase in terms of its inflow/outflow ratio; meanwhile, 35 percent more people left Portland, Oregon, than moved there. Click each city to see the inflow/outflow ratio for the past two years and year-over-year change.
Area with a year-over-year increase in people moving to it
Area with a year-over-year decrease in people moving to it
Source: LinkedIn
Infographic by Catalogtree
Infographic by Catalogtree
According to a separate data set provided by LinkedIn, the Bay Area had a net gain of technology workers in the 12 months that ended in July, with 1.12 people moving there for every one person who left—a 48 percent increase from the same time last year. (Last year, it had a net loss, with 0.76 people in the technology industry moving to the region for every one person who left.) The New York City Metropolitan Area saw a similar pattern.
In 2021, longer term remote policies had not yet been formed, Xu says, making it easy for technology workers in particular to move away or postpone their moves to these metropolitan areas. “Tech emerged as the industry with the greatest percentage of remote jobs. Many were not required to live near company headquarters in San Francisco or New York as companies decided on their remote work policies.” Now, though, more (but not all ) technology companies have implemented requirements for employees to spend some time on-site, potentially contributing to what researchers Arjun Ramani and Nicholas Bloom have called the donut effect —movement from city centers to the suburban areas around them.
The Other Great Reshuffle
When people first started working remotely in large numbers, it was hard to judge how wide-ranging the consequences would be. News outlets covered stories of remote-work “ zoomtowns ” in rural parts of the country like Idaho and Arkansas. But now, people seem to be settling closer to where they started: the office.
“The media stories about people going to rural areas may have been accurate for 2021,” says Riordan Frost, a researcher at the Harvard Joint Center for Housing Studies. Over the course of the pandemic, Frost says he did see rural counties go from a small net loss of people to a small net positive flow of newcomers. But in more recent data, he’s seen more of a re-sort, or reshuffle , than a mass exodus from cities.
“Many people are going to have some kind of hybrid situation with their work so they can have more flexibility to live wherever they want within a metropolitan area,” Frost says. “We’re seeing these suburban counties in the metropolitan areas really gaining migrants.”
Indeed, the October city-by-city Workforce reports show that the majority of workers were moving to more populated areas from suburbs or smaller cities in the same or nearby states, with the exception of large migrations to Austin from San Francisco, to Miami from New York City, and to Nashville and Seattle from Los Angeles. These moves were usually made by workers transferring from primary to secondary industry hubs, according to Xu. “San Francisco to Austin is tech; New York City to Miami is finance and the emergence of crypto; and Los Angeles to Seattle and Nashville is a mixture of healthcare, entertainment, and tech.”
Where People Are Coming From (and Moving To)
People moving to Washington, DC are mainly coming from surrounding areas, but people moving to Los Angeles are coming from DC. And people moving from LA are going to San Francisco. People who leave San Francisco are going to Austin. Select a city to see where people are going to (and coming from) when they move.
Population gain (per 10,000 LinkedIn members)
Population loss (per 10,000 LinkedIn members)
Moving from to...
Moving to from...
Source: LinkedIn
Infographic by Catalogtree
Infographic by Catalogtree
New Office Norms
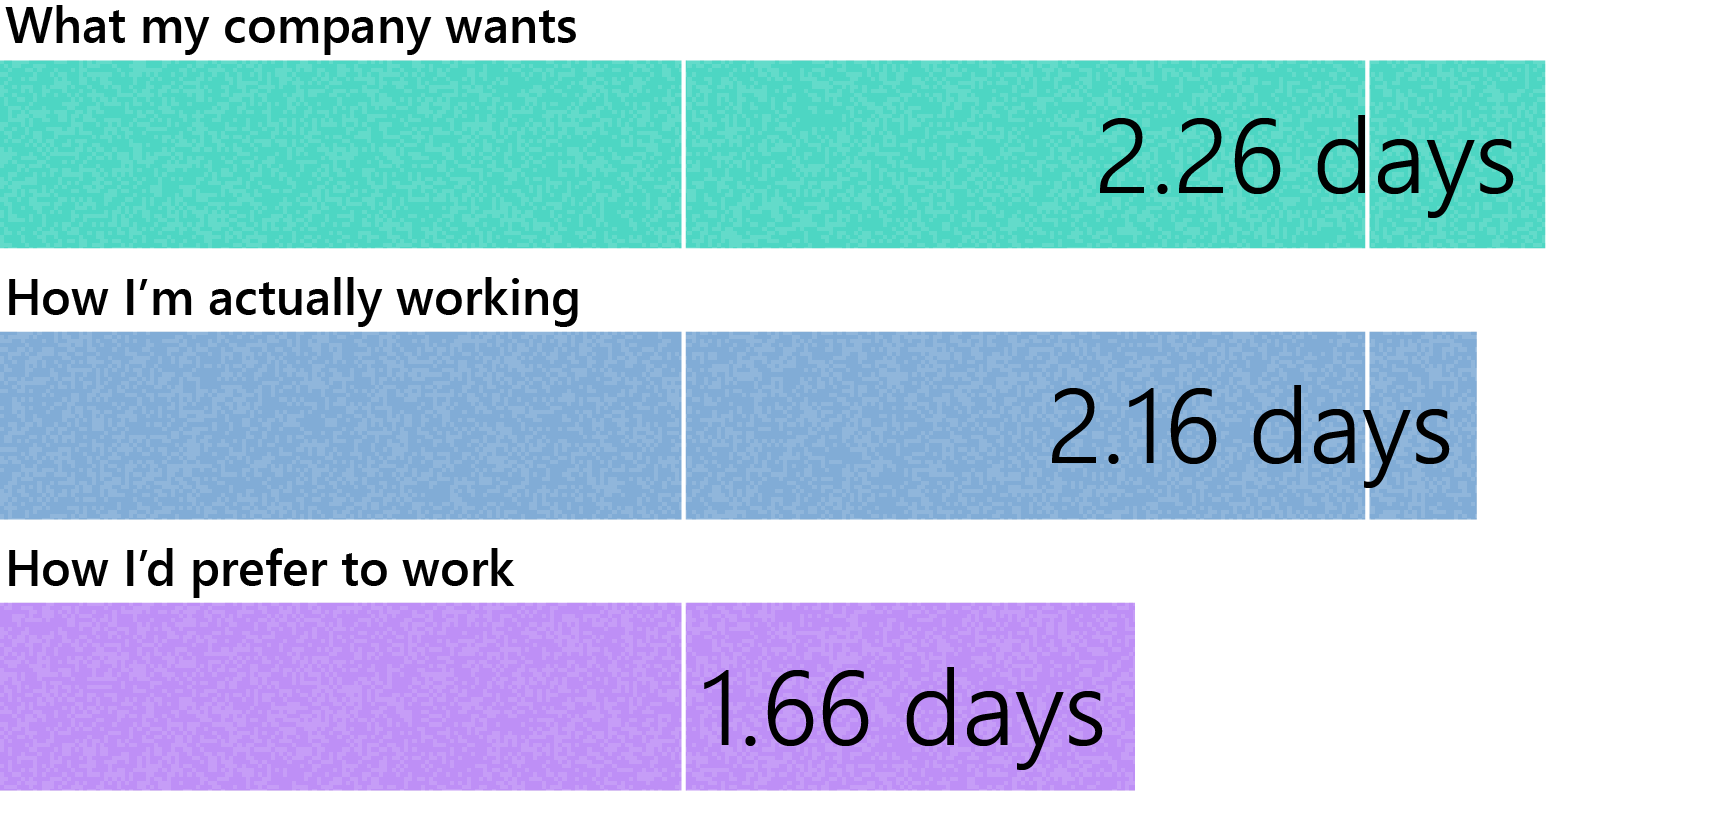
But even if people are returning to employment hubs, they still seek the flexibility they experienced over the past few years. Whether their workers are longtime locals or new arrivals, for now, most mid-to-large companies are resisting hard and fast 40-hours-a-week in-person requirements. According to our Work Trend Index 1 research, the average company requires 2.3 days per week on-site, and while the average employee is on-site 2.2 days per week, they’d prefer to go in for an average of 1.7 days instead. That data also shows that the most popular day for hybrid workers to go into the office is Wednesday. The least popular, perhaps unsurprisingly, is Friday.
What Workers Want
Most workers prefer to spend the majority of their time off-site, and on average they want to come into the office between one and two days per week.
Source: Microsoft Work Trend Index 2022
Infographic by Catalogtree
Austin was early to this hybrid way of working: Bryce Bencivengo, the director of public relations for the Austin Chamber of Commerce, says that before the pandemic, many employers there already offered remote or flexible work. People were used to working from home when they wanted, and companies there didn’t seem to have much trouble getting people back to the office when it was needed.
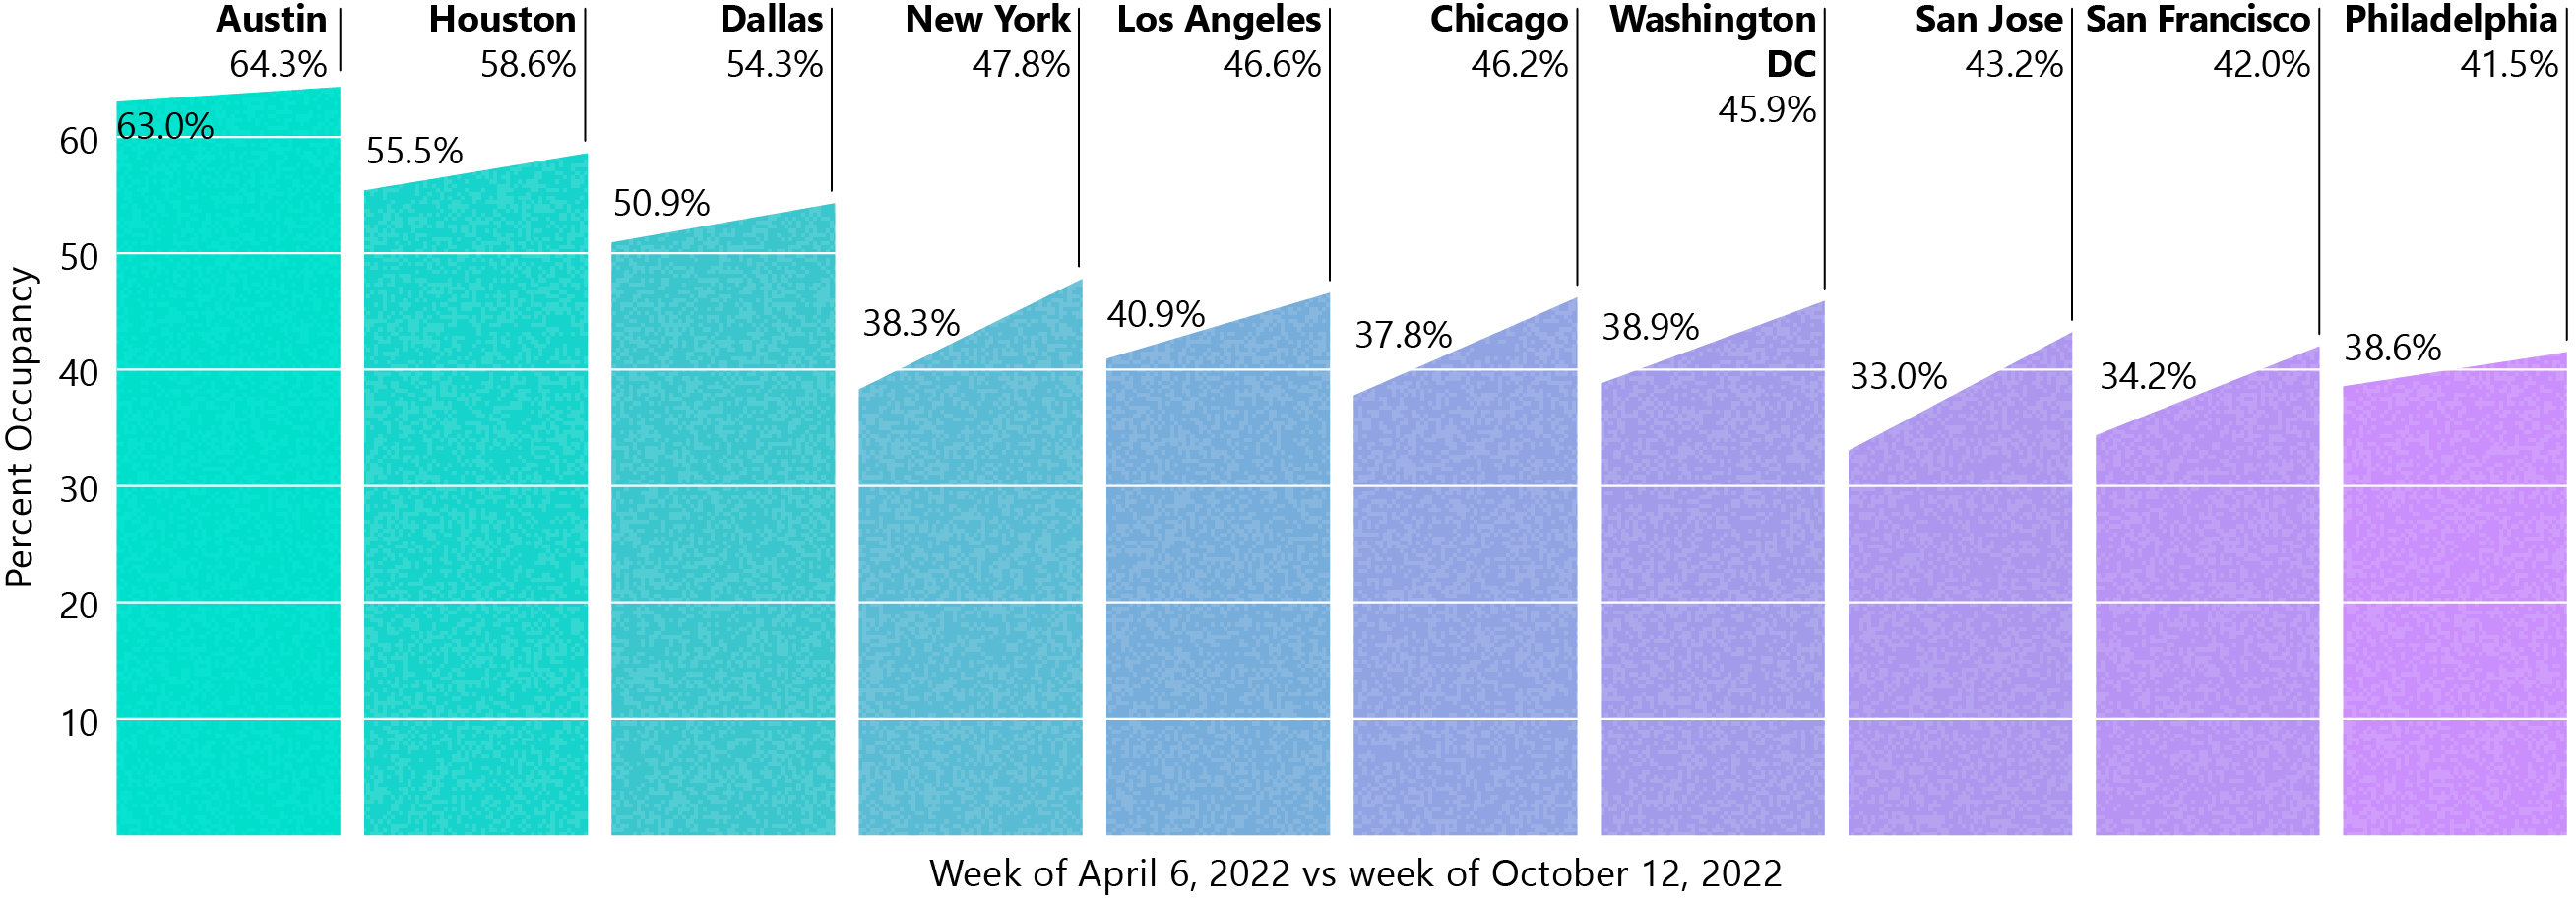
Austin Goes to Work
Austin has the highest office occupancy rate of any major city; San Francisco has one of the lowest. Shown below are office occupancy in percentages in April 2022 and October 2022.
Source: Kastle
Infographic by Catalogtree
New York and San Francisco had the biggest increases for the six-month period we looked at, but Austin currently has the highest office occupancy rate of any major US city (and has for the past year), according to keycard data from Kastle , a security management company. It’s a state that has been ascribed to the city’s relatively young population and, tech boom aside, the rise of industries in the area that tend to require more in-person time, like manufacturing and professional services.
Now, as people trickle back to the Bay Area, it remains to be seen if they’ll keep trickling back to the office too.
1 The survey was conducted by an independent research firm, Edelman Data & Intelligence, among 20,006 full-time employed or self-employed knowledge workers across 11 countries* between July 7, 2022, and August 2, 2022. This survey was 20 minutes in length and conducted online, in either the English language or translated into a local language across markets. At least 2,000 full-time workers were surveyed in each market, and global results have been aggregated across all responses to provide an average.
Each market was sampled to be representative of the full-time workforce across age, gender, and region; each sample included a mix of work environments (in-person, remote vs. non-remote; office settings vs. non-office settings, etc.), industries, company sizes, tenures, and job levels. The survey had broad representation across several different industries, including: automotive, construction, consumer packaged goods, education, energy, entertainment, fashion, financial services, food and beverage, government (state, local, or national), healthcare, hospitality, manufacturing, media and press, nonprofit, professional services, retail, technology, telecommunications, transportation, and travel and tourism.
Markets surveyed include: Australia and New Zealand (ANZ): Australia, New Zealand; Asia-Pacific (APAC): China, India, Japan; Europe: France, Germany, United Kingdom; Latin America (LATAM): Brazil; North America: Canada, United States. *Australia and New Zealand were analyzed as one market.