

Power BI Performance Tuning Workflow – Part 1

This is the first in a two-part blog series covers various tips and tricks on Power BI performance tuning. In this blog, the focus is on best practices related to data preparation and design data models to meet performance requirements.
Power BI is a cloud based analytics platform that provides self-service analytics at enterprise scale, unifying data from many sources to create interactive, immersive dashboards and reports that provide actionable insights and drive business results.
One of the common issues we hear is that a “Power BI report is running slow”. Broadly, the areas that can be optimised and tuned are as follows:
- The data source(s) – Is it on-premises or in Azure? Structured or Unstructured?
- The data model – Does it use a Snowflake or Star model? Is it Normalised or De-normalised?
- Visualisations – this included dashboards and Power BI reports. Are you using a Table or Matrix? Charts or Graph? Custom or Built-in?
- Infrastructure – including capacities, data gateways, and the network etc.

Inappropriate use of Direct Query and Import
Import mode is the most common mode used to develop models. This mode delivers extremely fast performance thanks to in-memory querying and provides complete DAX support. Because of these strengths, it’s the default mode when creating a new Power BI desktop solution.
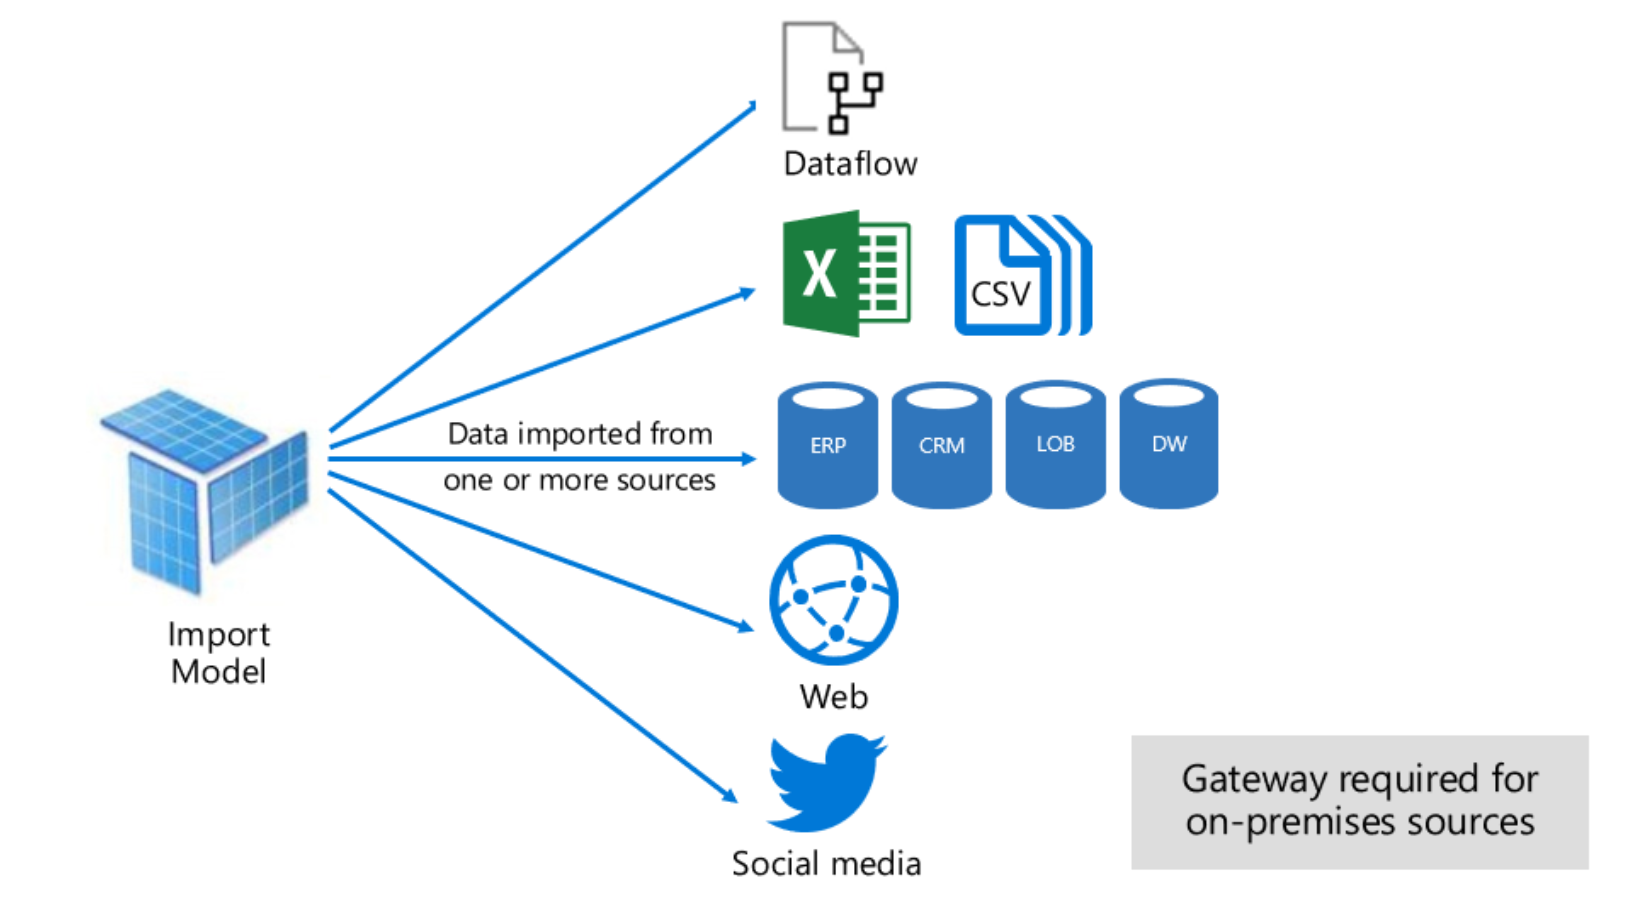 Direct Query mode is an alternative to the Import model. The model in this mode consists only of metadata defining the model structure. When the model is queried, queries that are compatible with the underlying data sources are fired off in the background to retrieve data.

Considerations for Import
The Power BI engine offers around 5-10x compression depending on the data type and values. In a shared capacity, the import model can store around 1GB of data but can scale using premium capacity that supports larger datasets. However, you should avoid the import model in these situations:
- The dataset is very large and cannot fit in the available capacity.
- You need real-time insights for reporting. Import works on the refresh model, and will not suffice for data refreshing every few seconds or minutes.
Considerations for Live Connection and Direct Query
This is essentially the opposite to the Import model. Whenever you need real time data for reporting or analytics or you cannot store your data in the Power BI workspace (shared or premium, based on your environment), use Direct Query.
If your team or organisation already uses a tabular model, you can continue with AAS or SSAS tabular for live connection scenarios.
There are limitations of a Direct Query model, including extra network round-trips to retrieve the dataset from the source. DAX coverage is also limited and depends on the supportability w.r.t to the various data sources.
Data Refresh
- Schedule your refreshes for less busy times, especially if your datasets are on Power BI Premium.
- Keep refresh limits in mind. If the source data changes frequently or the data volume is substantial, consider using DirectQuery/LiveConnect mode instead of Import mode if the increased load at the source and the impact on query performance are acceptable.
- Verify that your dataset refresh time does not exceed the maximum refresh duration.
- Use a reliable enterprise data gateway deployment to connect your datasets to on-premises data sources.
- Use separate data gateways for Import datasets and DirectQuery/LiveConnect datasets so that the data imports during scheduled refresh doesn’t impact the performance of reports and dashboards on top of DirectQuery/LiveConnect datasets.
- Configure failure notifications and send emails to your mailbox when any refresh fails.
- Configure incremental refresh for datasets that are filtered by using Power Query date/time parameters with the reserved, case-sensitive names RangeStart and RangeEnd. This will minimise the memory footprint and reduce refresh time.
Use Query Caching
Query caching is a premium feature that provides performance benefits when a dataset is accessed frequently and doesn’t need to be refreshed often.
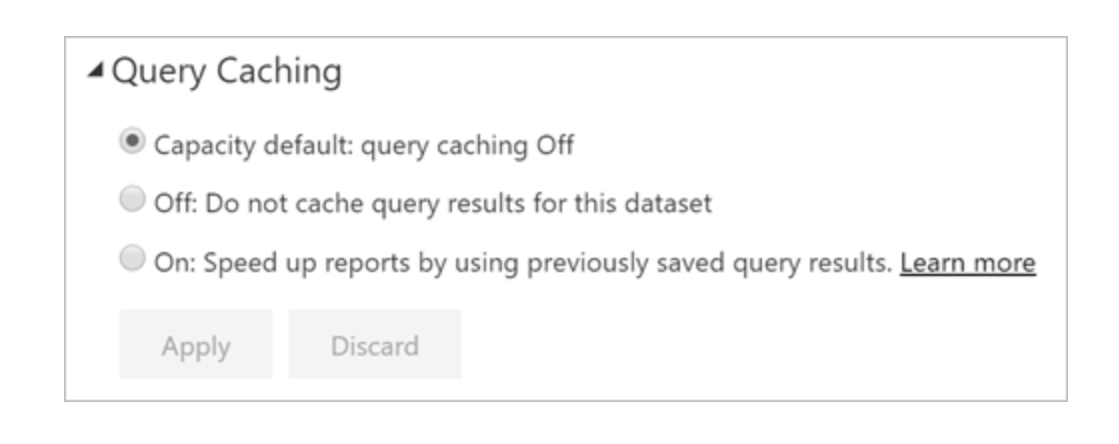
Query caching can also minimise load on premium workspaces because it reuses the existing cached data and overall reduced the number of queries.
Data Loading
Modelling Improvements
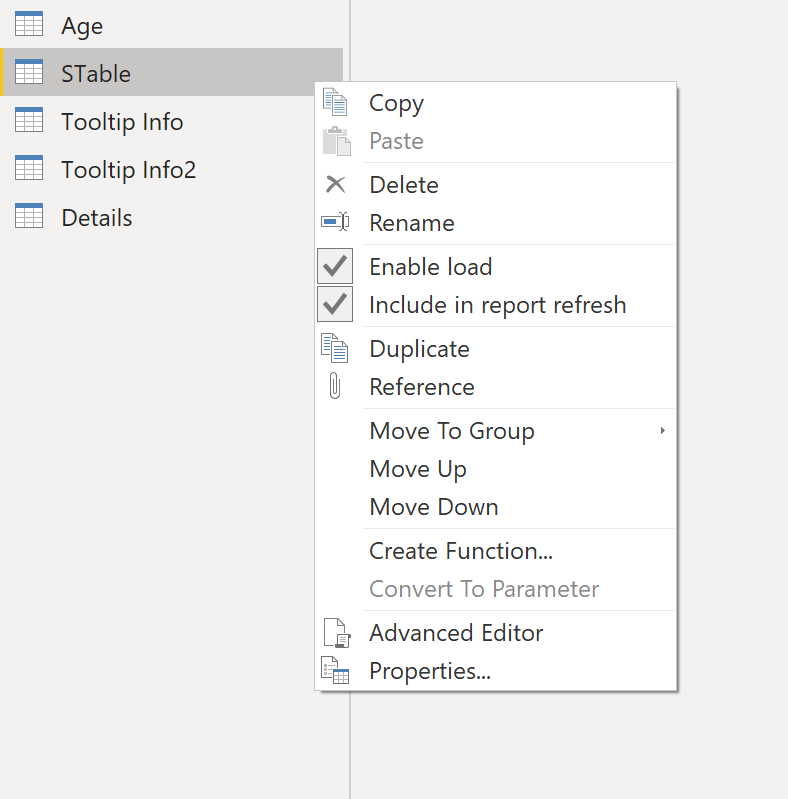
In Power BI models, there can be intermediate tables used as staging layers or custom queries that the author hides to prevent access. These hidden tables consume memory, and one way to improve performance is to disable load. Don’t get confused with the “Hide in report view” option. This only removes from the view, but the table is still loaded in the model and consumes memory.
Don’t use Auto Date/Time
The Auto date/time is a data load option in Power BI Desktop. When the date columns are loaded into the model, this feature helps developers to create time-based visuals easily.
If a data model has many date/time fields, this setting can create several internal tables and increase the memory footprint of small models.

GroupKind.Local
GroupKind.Local performs faster than the default setting. When the data is sorted or in continuous fashion you can speed up your grouping operations considerably. You can read more about this on Microsoft Docs.
Data models
Star Schema
Star schema is a mature modelling approach widely adopted by relational data warehouses. It requires modellers to classify their model tables as either dimension or fact.
A well-structured model design should include tables that are either dimension-type tables or fact-type tables. Avoid mixing the two types of tables into a single table that might have dimension fields or additive measures. We also recommend that you should try to create the right number of tables with the right relationships in place.

You can read more about Star Schema on Microsoft Docs.
Prefer integers over strings
Integers are a fixed length datatype that use run length encoding, whereas strings use dictionary encoding. Also, if you sort the column data using the integer column, the level of compression will be significant higher. The Power BI segments boundary is 1 million.
Avoid high precision/cardinality columns
If you create models that have higher precision such as numeric or date/time etc, it reduces the compression ratio and increases load times. Wherever possible, find ways to reduce precision without impacting business requirements.
For example, Date has a precision of milliseconds. Use Date only if you need to use Date, Time if you only need to use Time. Also, reduce the precision and round off to values wherever possible.
Lean Model
The source tables or views might have many columns, but in your data model the area of interest might be restricted to a few rows. For example, auditing columns such as Last Modified are not useful for an analytics purpose. Remove unwanted tables or columns in the model, as this will reduce the model size and improve refresh times.
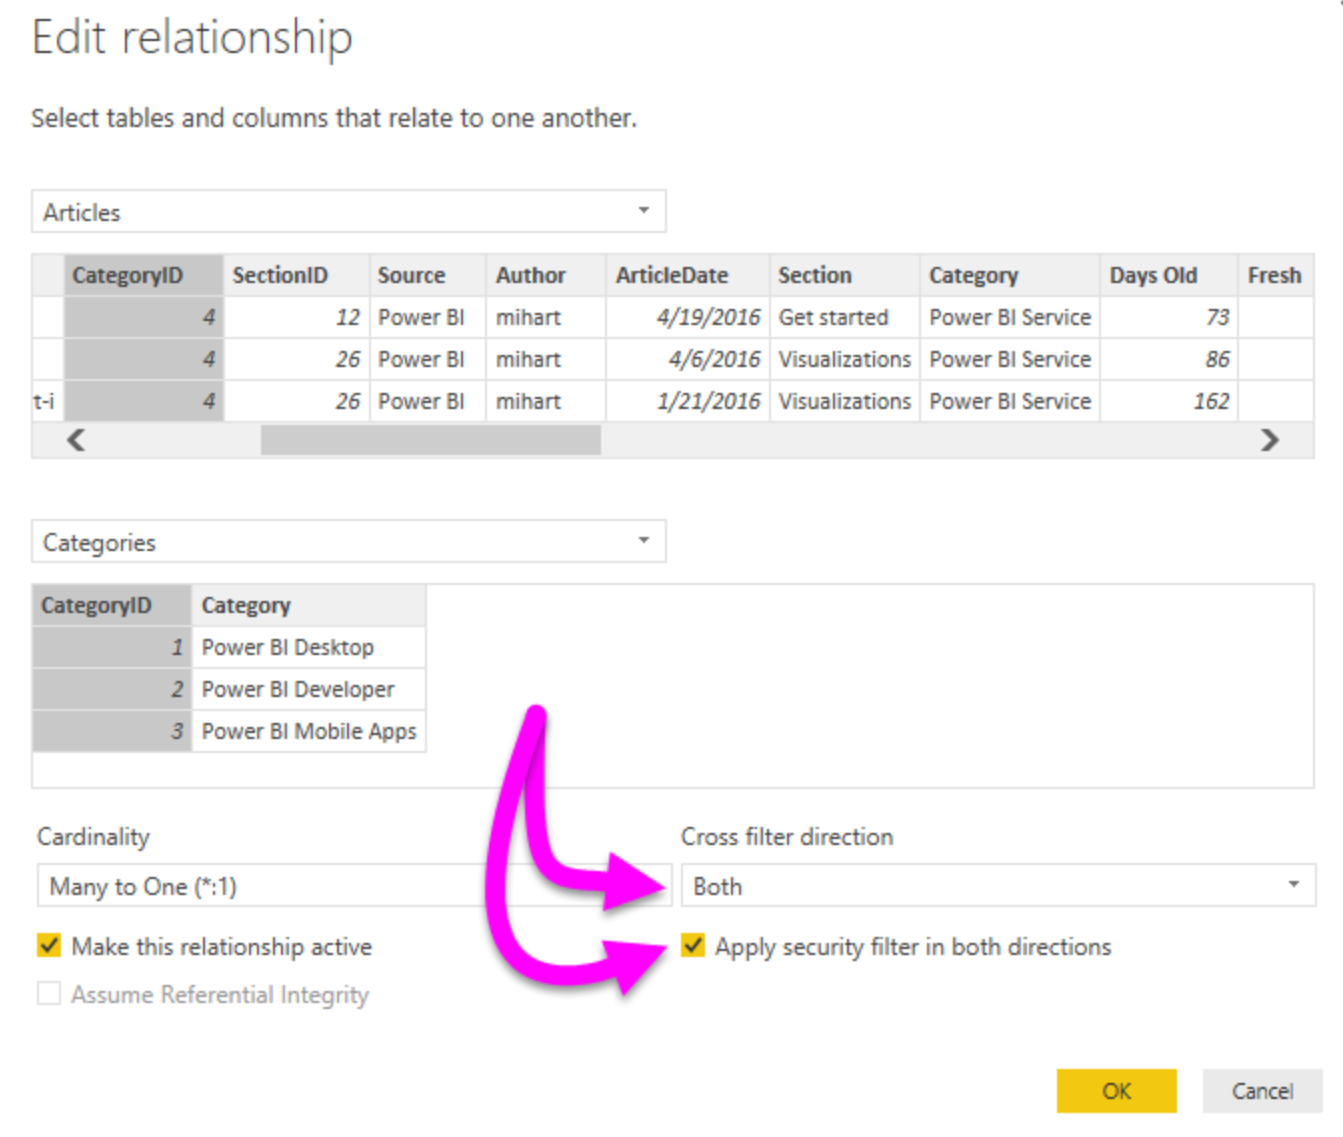
Bi-Directional Relationships
The bi-directional cross-filtering feature is very powerful, and it allows us to solve complex models with more ease. However, if you have a model which is full of bi-directional filters, any slicing or filtering activity might slow down because of the relationship propagation chain.
Also, if not modelled correctly, you might see inconsistent behaviour, particularly in a snowflake architecture.
Default Aggregations
Not all numeric columns are additive in nature, such as surrogate columns or primary keys. By default, when any numeric column is placed on a visual, Power BI will aggregate that column, increasing the report compute time. It’s recommended that you change the default aggregations to none for such columns. One of the key points is that the fact-type tables always load data at the correct granularity level. If you have a higher granularity, you would miss detailed information. Too low, and it becomes too detailed for reports, and you have a cost-inefficient large model size.
Composite Model and Aggregations
Whenever possible, it’s best to develop a model in Import mode. This mode provides the greatest design flexibility and best performance. However, challenges related to large data volumes, or reporting on near real-time data, cannot be solved by Import models. In either of these cases, you can consider a DirectQuery model, providing your data is stored in a single data source that’s supported by DirectQuery mode.
Further, you can consider developing a Composite model in the following situations:
- Your model could be a DirectQuery model, but you want to boost performance. In a Composite model, performance can be improved by configuring appropriate storage for each table. You can also add aggregations.
- You can also add aggregations to store aggregated fact data in the PBI import mode.
- You want to combine a DirectQuery model with additional data, which must be imported into the model. Imported data can be loaded from a different data source, or from calculated tables.
- You want to combine two or more DirectQuery data sources into a single model.
You can read more about Desktop Composite Models on Microsoft Docs.
Important composite best practices
- Set the storage mode to DirectQuery when a table is a fact-type table storing large data volumes, or it needs to deliver near real-time results.
- Set the storage mode to Dual when a table is a dimension-type table, and it will be queried together with DirectQuery fact-type tables based on the same source.
Aggregations
- You can add aggregations to DirectQuery tables in your Composite model. Aggregations are cached in the model, so they behave as Import tables. Their purpose is to improve performance for “higher grain” queries.
- We recommend that an aggregation table follows a basic rule: Its row count should be at least a factor of 10 smaller than the underlying table.
Be sure to check out part two, which looks at optimisations you can make to certain calculations, row-level security, dashboard design and more!