

A Practical Approach to Monitoring Your Cloud Workloads – Example 1: Networking
In the first post of this series, we gave you a high-level overview of the six steps which will help you determine what to monitor in your cloud workloads. We also said that, in order to cement your understanding, we would be releasing some specific example scenarios to help bring this to life. Today we are discussing a real-world example of how you would monitor networking in Azure.
Networking example overview
This example demonstrates how to apply the six-step process to a simple Hub and Spoke network architecture deployment to create a first pass end-to-end monitoring solution. If you are unfamiliar with the concept of the Hub and Spoke then please visit the Microsoft documentation that describes the Azure Landing Zone.
Remember that we are only aiming to achieve a starting point or baseline. If we continually analyse for every metric, log and alert we will never get anything done! We will also learn over time and include new metrics as we see fit.
Without further ado, let’s dive in.
Step 1: Evaluate Workload
The first step in determining what you need to monitor for your Azure workload is to identify all of the Azure resources included as part of the end-to-end solution. The approach recommended here is:
- Create a full architecture diagram of the end-to-end solution.
- Create a list of all the Azure resources included in the solution.
Create an Architecture Diagram
The following image depicts a simple network drawing showing hub and spoke network connectivity back to on-prem via a VPN gateway and an Azure Firewall.

Create an Azure Resource List
From the architecture drawing you can now derive a list of all the Azure resource types involved in this solution as follows:

Step 2: Review Available Metrics, Logs and Services
You may already have a clear list of monitoring requirements, but it is worth cross checking these with what is available ‘out of the box’ from a metrics and logs perspective for each Azure resource involved in the solution. The approach recommended here is:
- For each Azure service gather the available metrics.
- For each Azure service identify additional associated monitoring logs and services.
Metrics and logs are different things, and it is important to understand and capture both for all the resources in your deployment. To use our car analogy again, metrics can be thought of as your speedometer where small pieces of telemetry information are sent in near real-time to your car dashboard. Logs would be fault messages recorded that have their own structure and would be read at a later date and analysed using queries.
Gather Available Metrics
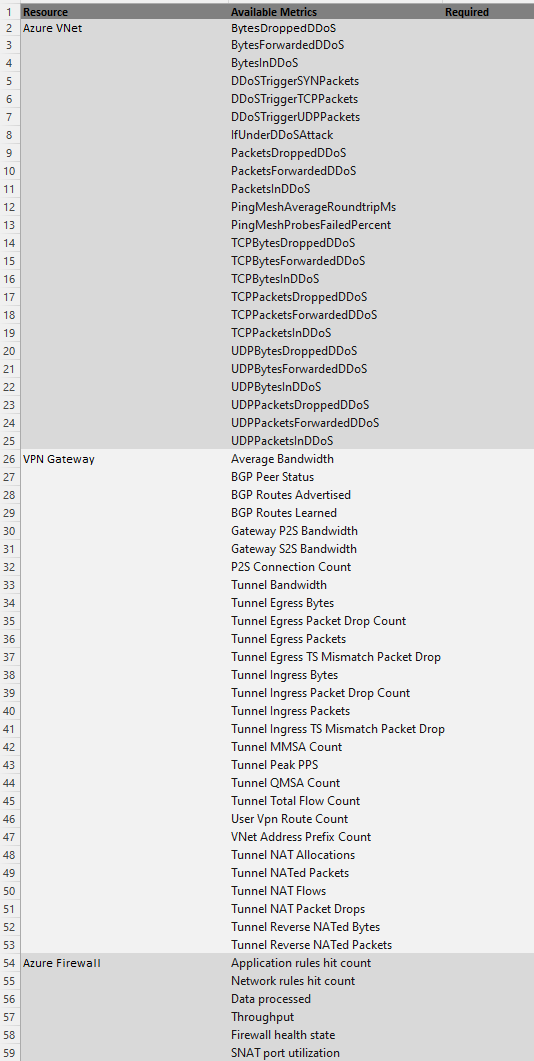
You can either grab the available metrics for your Azure resources manually from the supported metrics page. Alternatively, you can use this script for automatically obtaining all metrics for Azure resources that you already have deployed. You just point the script at your chosen scope (subscription, resource group etc.) and let it run. For this example, you will end up with a list of metrics like this:
Identify Associated Monitoring Logs and Services
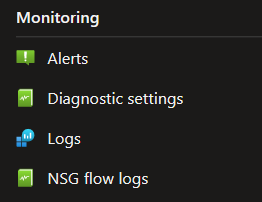
By looking at the Azure Portal under the Monitoring section for each Azure Resource or by reading the documentation associated with each Azure resource, you can identify possible additional sources of monitoring information. Broadly speaking, there are three considerations here for each resource:
- Activity Log: This provides insight into subscription-level events. The activity log includes information like when a resource is modified, or when a virtual machine is started. You may find it useful to monitor when a resource is changed in some way. These logs can be routed to a destination like Log Analytics.
- Monitor Logs: Different resources will capture different logs and these can be queried in Log Analytics. You can also use Alerts to pro-actively warn you of situations as they arise.
- Diagnostic Settings: Each Azure resource requires its own diagnostic setting, which defines the type of metric and log data to send to the destinations defined in the setting. The available types vary by resource type. Setting this up is an important step because NO resource logs are collected until they are routed to a destination.
For example, in addition to metrics, from the Azure portal we can see the following for the Azure Network Security Group resource:
Looking more closely into the Diagnostic Settings we can see that there are two categories of logs we can use. If we send them to Log Analytics they can be queried.

Each of the resources will have their own documentation and this is the specific documentation for the NSG.
It will take time, but you need to do this as there may be a log that is vital to you. Looking through each of the resources in our networking example we could derive a starting list like this:

Summarised as follows:
| Log Based Monitoring Options |
|---|
| Connection Monitor (Network Watcher) |
| Azure Firewall Logs |
| Virtual Machine Insights |
| Virtual Machine Logs (AMA) |
| NSG Flow Logs |
| Activity Logs |
| Diagnostics Logs |
| Alerts (Azure Monitor) |
Step 3: Assemble your requirements
The next very important stage is to assemble some coherent requirements. It is important to understand the ‘What’, ‘Who’ and ‘How’ for each monitoring requirement and so the recommended approach is to carefully write these requirements in the format:
- As a {named individual/team} I want {a specific measurable outcome} so that {the rationale for this}.
You should also categorise your monitoring requirements. For example, wanting to receive an alert email for a metric threshold breach is not the same as wanting a dashboard showing the variation in that metric over the last 90 days. Therefore, you could classify the former as an ‘ALERT’ category whilst the latter is a ‘PERFORMANCE’ category.
As a starting point, you should consider making a list of these ‘User Stories’. A User Story is an end state that describes something as told from the perspective of the person desiring the functionality. It is widely used in software development as a small unit of work. You can then categorise your stories into different sections together with a success criteria referred to as ‘Definition of Done’ (DoD). This approach works very well for monitoring requirements. Here are some suggested category examples, and you may want to add some of your own:
- ‘Alert’
- Definition: Notification when monitored thresholds are breached
- Format: email, text, alarm console bulb, web hook etc.
- ‘Performance’
- Definition: Variation of a measured value over time
- Format: dashboards (graphs, time series), emailed reports etc.
- ‘Troubleshooting’
- Definition: Pro-active investigations into specific issues
- Format: logs
With this approach you can write a monitoring requirement like this example:
| Title | Action | Comments |
|---|---|---|
| VPN Connectivity Alerts | Story | As a ‘Cloud Operations Engineer’, I want to be able to receive an alert notification by email when connectivity from Azure to on-prem over the VPN connection fails, this is so that I can immediately investigate and remediate the issue. |
| DoD | • Is triggered when packet transfer from Azure NIC to on-prem NIC over the VPN link fails to arrive. | |
| • An alert notification email received to the ‘cloud support engineering’ email alias within 15 minutes of the occurrence. |
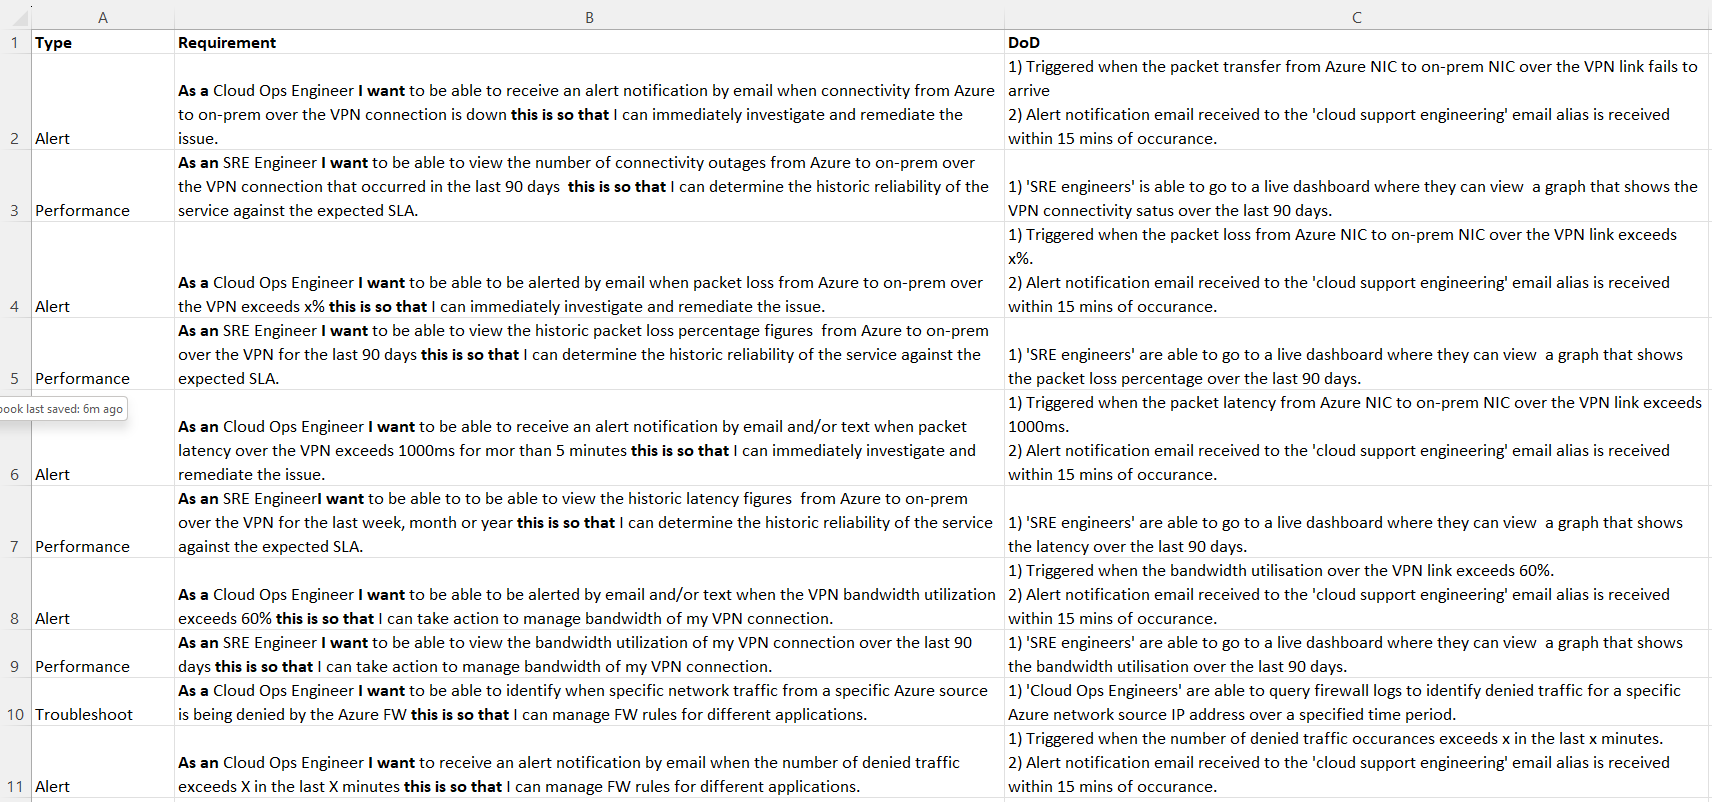
So, for our networking example here, we could assemble some of our requirements like this:
Step 4: Map your requirements to metrics, logs and services
This is an iterative process of evaluating available metrics and logs for each of your Azure resources and then mapping which of these meet your requirements as defined in Step 3. This may result in you spotting new requirements to add to the list as well as identifying where an ‘Out of the Box’ metric can meet that requirement. So, the approach here is:
- Iteratively review the Azure metrics against your requirements from the previous step and select which one will satisfy it.
- Iteratively review the Azure logs against your requirements from the previous step and select which one will satisfy it.
For example, looking at the metrics list, we can see that requirements 4, 5, 8 and 9 can be satisfied with ‘Out of the Box’ available metrics:
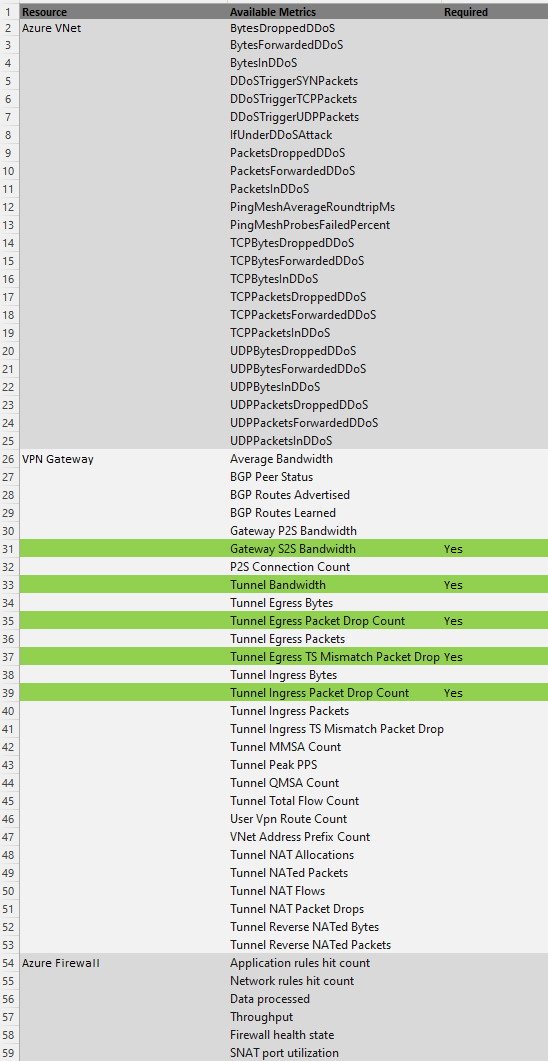
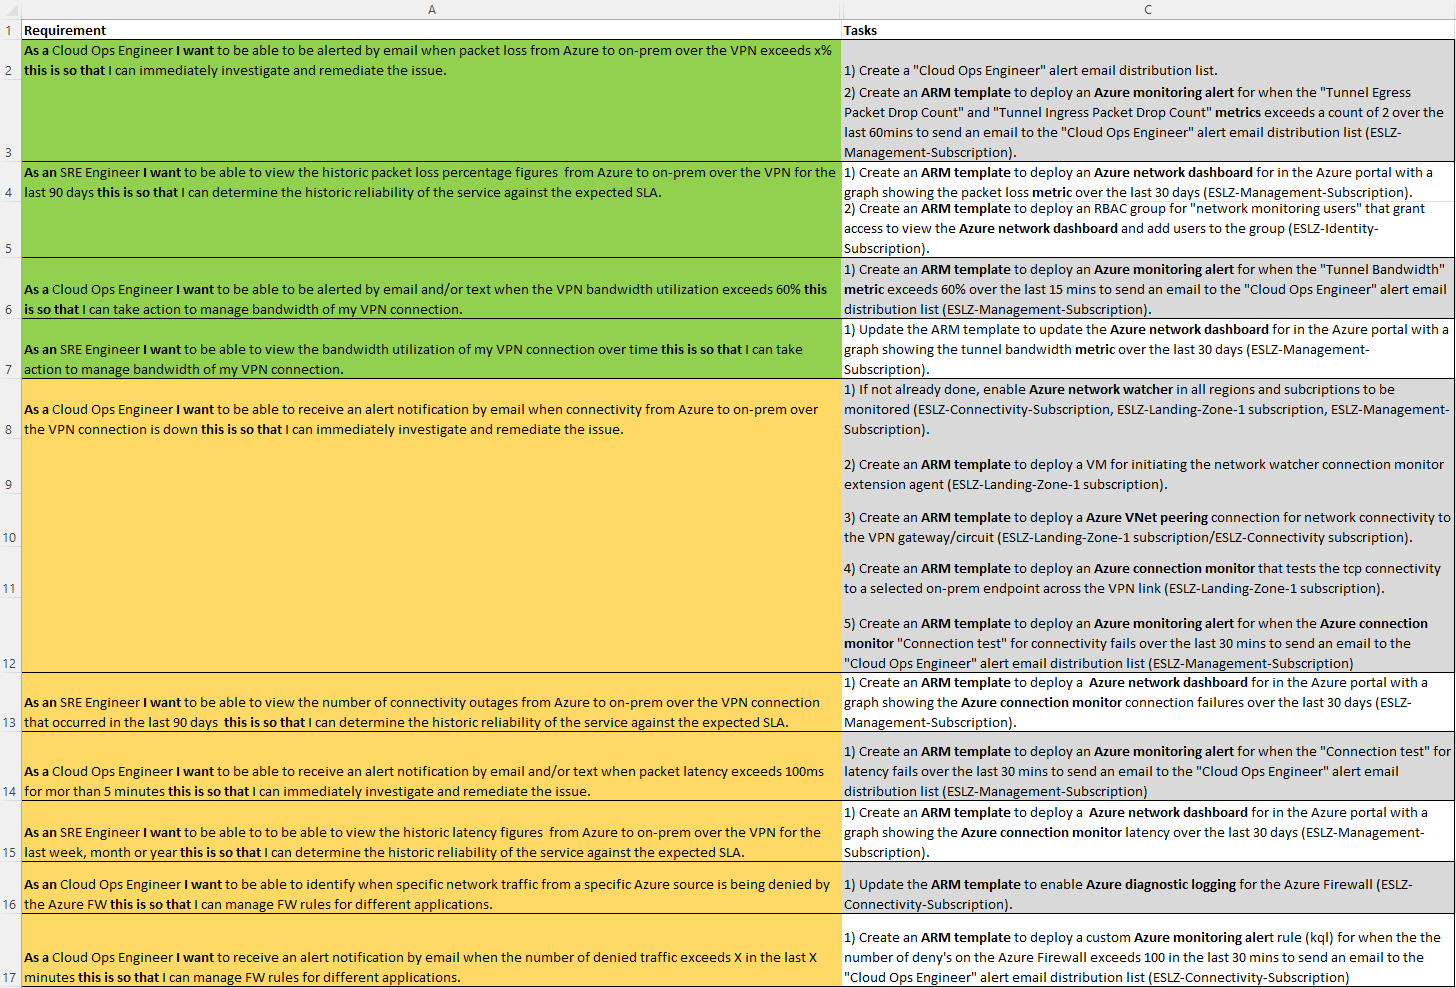
So, for our networking example here, we could map some of our requirements to Azure metrics and logs as below, where the green highlights are showing where a metric can meet a requirement from the requirements list and the yellow where an alternative log base solution is required:

Step 5: Populate your backlog stories
The next stage is to convert the outputs from the previous stages to generate a list of actual tasks for implementation of the monitoring requirements. The approach here is:
- Identify the service and tools you will use to implement your requirements.
- Create a list of tasks for each of your requirements for implementation in your Azure environment/landing zone.
These tasks will need to map to the specifics of your Azure landing zone. For example, if the environment is managed through CI/CD pipelines and uses ARM templates, then the tasks could involve the creation of ARM templates to implement your monitoring solution as shown in our example below. However, this may not be the case for your environment as maybe you are using Terraform or something else.
For our networking example, the list of Azure services that has been selected to meet the requirements is as follows:
| Azure Services |
|---|
| Azure Resource Manager (ARM) Templates |
| Alerts (Azure Monitor) |
| Azure Metrics |
| Azure Network Watcher |
| Azure Connectivity Monitor |
| Azure Dashboards |
| Azure Firewall Diagnostics |
This in turn leads to a first pass at populating a backlog of tasks for our network example as follows:
Here you will also notice (shown in bold) that this is where you are selecting the tools that meet your requirements. In this example Azure tools such as Azure Monitor, Azure Network Watcher etc. have been selected but this could be anything that fits your preference or environment constraints.
Step 6: Data retention considerations
The final step is to understand how long you need to keep your logs and metrics. Once you’ve configured the logging and metrics across your resources, information will need to be sent to a destination. At last, you’ll have the visibility you need but it comes at a financial cost. Therefore, you will need to look at both your Functional Requirements and Non-Functional Requirements to assess the correct retention and archive period.
As an example: Let’s say your functional requirement states that you need 90 days of data as a minimum to satisfy some performance requirements and your non-functional data requirements state you need 7 years for archiving. In this example, as with many others, the trade-off is requirements vs cost. We can look at a lower cost data archive storage model for data after 90 days has expired in order to keep costs down.
First let’s consider the metrics. As detailed here, platform and custom metrics are stored for 93 days but you can route them to a destination such as Azure storage where you can keep them indefinitely, to a third-party solution via Event Hubs or to a Log Analytics workspace where different retention periods apply.
And, as with metrics, it goes without saying that Azure Monitor can help with logging data, and we can adjust the settings on our Log Analytics workspace to accommodate our needs. The first thing we need to understand is that there are two different periods: a Retention period and an Archiving period. All of this is detailed here, but in essence during the interactive retention period, data is available for monitoring, troubleshooting, and analytics. When you no longer use the logs, but still need to keep the data for compliance or occasional investigation, archive the logs to save costs. Archived data stays in the same table, alongside the data that’s available for interactive queries. By default, all tables in your workspace inherit the workspace’s interactive retention setting and have no archive policy. You can modify the retention and archive policies of individual tables, except for workspaces in the legacy Free Trial pricing tier.
If all the data ingested into the Log Analytics workspace must be available for analysis and troubleshooting for 90 days, the default workspace retention policy can be changed to 90 days. That solves the functional requirement mandate. For the non-functional requirement, we would need to set an archive policy per table, and we can use 2556 days (7 years) as the setting. These settings would satisfy our example requirements here.
As another option, you can export your logs from the Log Analytics workspace to another destination. This is detailed here. What this means is that you can choose not to archive the data in Log Analytics but instead archive it somewhere else which may be a lower cost option for you whilst conforming to your requirements.
Summary
This concludes the first of our examples into how you can define and configure a monitoring strategy. In this post we used a real-world scenario based around networking and showed you the practical examples of each step.
As a reminder, don’t spend a large amount of time trying to gather every single eventuality for your user stories. Monitoring is a large and evolving topic so it’s realistic to expect that things may change over time. With that in mind aim for a Minimum Viable Product and build from there. That way you will start to get value from your monitoring strategy far quicker.