

Maps Visualization
Harness maps visualization for better business decision-making.
Azure Maps offers an integrated suite of visualization capabilities that make your maps and location data more interactive and insightful.
Interactive maps made easy
Enhance your applications with powerful map-based visualizations including real-time weather overlays to advanced spatial analysis.
Dynamic Visualization
Visualize real-time data and responsive design that enhances your application’s user experience.
Power BI Integration
Azure Maps powers powerful spatial data visualizations and analysis in Power BI.
Customizable Options
Style map layers and add custom data overlays, and more to fit your brand and application requirements.
Comprehensive Coverage
Accurate and up-to-date data on a wide array of global maps and geographic information.
Interactive and customizable maps
Give users the ability to zoom, click, and explore. Azure Maps’ visualization APIs bring your data to life and provide an engaging hands-on experience that captivates your audience.
Power BI maps visualization
This integration simplifies the visualization of geographical data by turning complex datasets into easy-to-understand, interactive maps. Visualize sales trends, track logistics in real-time, or assess market penetration—all within the familiar Power BI environment.
Advanced data storytelling
Uncover deeper insights with advanced maps visualization techniques such as heatmaps, clusterings, and more. This is useful for analyzing traffic flow, monitoring environmental changes, tracking resource distribution, and more.
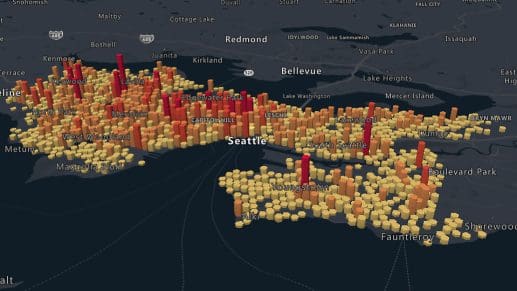
3D Map visualizations
Create stunning 3D visualizations to represent terrain, buildings, and other structures in three dimensions for a more immersive and detailed perspective of your data.
Traffic visualization
Integrate real-time traffic data into your maps to help you or your users make informed decisions about travel and logistics. This also includes congestion and incidents.
Route visualization
Provide clear paths and turn-by-turn navigation for various modes of transport, including walking, driving, and public transit.
Azure Maps Visualization
Azure Maps equips you with a rich toolkit for creating sophisticated, interactive applications. Inform and impress your users with visualizations of everything from real-time traffic updates to detailed urban planning.
Azure Maps Visualization APIs

Your toolkit for advanced maps visualization
Azure Maps is your comprehensive solution for bringing geographical data to life. By leveraging the Azure Maps Power BI visual, you are provided with a rich set of data visualizations that are overlaid on a map. All of this information is vital in learning how location context relates to your business data.
Ready to start building?

Get started
Our platform provides you with everything you need — from subscription keys for API authentication to a plethora of code samples, demos and SDKs.

Documentation
Complete with code samples, SDK support, and detailed explanations, this is a one-stop resource for enhancing your projects with the wide range of Azure Maps APIs.

Samples
These pre-written snippets show how to perform various API calls for current weather, forecasts, and severe weather alerts, among other functionalities.
Frequently asked questions
-
Azure Maps allows you to create a wide range of visualizations, including dynamic interactive maps, 3D map visualizations, heat maps, traffic visualizations, route visualizations, and indoor maps. You can also perform advanced data visualization techniques like clustering and overlay weather data directly onto your maps.
-
Azure Maps is available as a custom visual within Power BI, which you can add to your report from the Power BI Visuals marketplace. The integration is seamless and does not require any special configuration or coding.
-
Yes. You can overlay real-time data feeds onto your maps for scenarios such as live traffic updates, weather conditions, and tracking moving assets.
-
Absolutely. Azure Maps offers extensive customization options. You can adjust styles, colors, and layers to match your application’s look and feel. You can also add custom points of interest, icons, and labels to highlight specific information.
-
First, you’ll need to create an Azure account and set up Azure Maps. Once set up, you can access Azure Maps APIs and SDKs, which provide the tools and documentation needed to integrate map visualization into your applications. Check out our tutorials and guides to help you begin.

Azure Maps
Advanced mapping and visualization features for your applications.
More features from Azure Maps

Data and Insights
Process and analyze massive amounts of real-time and historical location data with Azure Data services to find the best possible solutions to logistics challenges.

Location Services
Map supply chains, locate POIs, and create customized experiences with powerful geolocation data, all backed by robust search APIs and extensive GIS databases.
Mapping and Visualization
Create varied, fully customizable, and interactive graphs that inform creative decision-making. Experience a new way of visualizing your data.