“It is difficult to make predictions, especially about the future,” said Danish physicist, Niels Bohr. Well, it just got a lot easier with Excel’s one-click forecasting.
Often we use Excel to analyze time-based series data—like sales, server utilization or inventory data—to find recurring seasonality patterns and trends. In Excel 2016, new forecasting sheet functions and one-click forecasting helps you to explain the data and understand future trends.
Let’s take a closer look at some of the capabilities that come with these new features, including how to detect seasonality, understand the level of confidence in the prediction, and create the forecast in one-click.
Using Exponential Smoothing for forecasting
There are many ways to generate a forecast for your historical data. Before Excel 2016, many used the FORECAST() sheet function, which performs a linear forecast or extended trendlines in chart properties to extrapolate forward.
The new functionality in Excel 2016 utilizes another algorithm, called Exponential Smoothing or ETS. Exponential Smoothing methods are a popular way to forecast and are among the leading methods that have become industry standards.
The main advantages of using the ETS method are the ability to detect seasonality patterns and confidence intervals.
Seasonality patterns
In many business scenarios there is a seasonality pattern that we would like to take into account in the forecast. An example of this could be ice cream sales presented in monthly data. We would expect to have a yearly cycle in this case, which would repeat itself every 12 points (months). Another example is hourly traffic data, where a seasonality of 24 points (hours) makes sense.
In the example below you can see how a yearly seasonality was detected and applied in the forecast. Since the data is monthly and repeats every 12 points, the detected seasonality was 12.
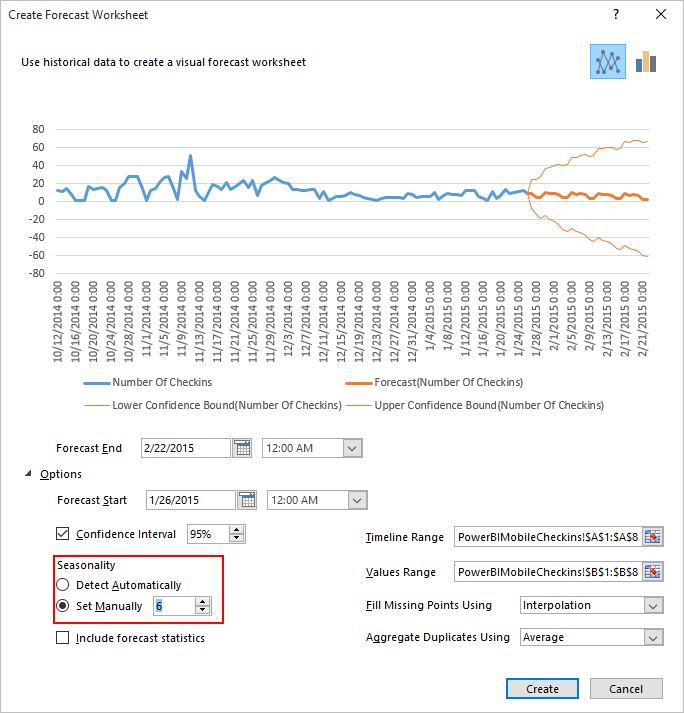
In some cases we know what the seasonality length is, but in other cases we do not. This forecasting method looks for seasonality patterns in the historical data and tries to determine the pattern that best matches the data. For this to work properly, the more repeating cycles the historical data contains the better. It is recommended to have at least 2–3 full seasonal cycles in the historical data. The automatically detected value in the Seasonality section can be found in the Create Forecast dialog under Options. In case the seasonal data was not significant enough to be detected, or you know which seasonality you expect, you can manually override the automatically detected value by selecting Set Manually.
Confidence intervals
Apart from predicting future values for the input time series, the ETS forecast can also return a confidence interval.
The confidence interval is the range surrounding each predicted value in which 95 percent of future points are expected to fall based on the forecast (with normal distribution). The confidence interval helps you figure out the accuracy of the prediction. A smaller interval implies more confidence in the prediction for the specific point. The default level of 95 percent confidence can be changed using the up or down arrows and can be used in two ways:
- You can deduct from the width of the confidence interval to understand the accuracy of the prediction.
- You can experiment with several of the advanced options (such as how to account for missing points, seasonality, etc.) and observe if the previewed confidence interval got thinner or wider. This provides an indication of how well the underlying model fits the historical data.
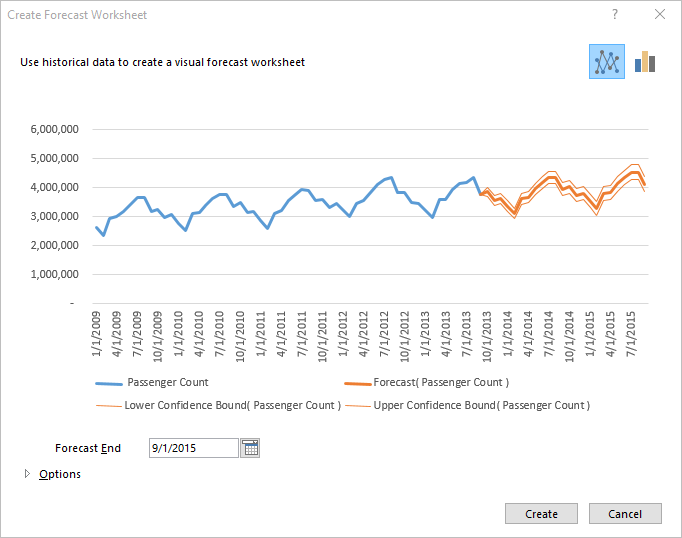
How do I create a forecast?
To create a forecast sheet, first make sure you have your time-based series data set ready (it should have a time series and values series). Next, under the Data tab, click the Forecast sheet button. This launches the forecast dialog that walks you through the process. For detailed instructions on how to create a forecast, visit Create a forecast in Excel 2016 for Windows. Alternatively, if you are comfortable with using sheet functions, you can do exactly the same using the new FORECAST.ETS* sheet functions, which are described here: Forecasting Functions Help. Using the functions allows you to use the exact same functionality.
How do I know whether my data is forecasted accurately? Can trust it?
As with many statistical tools, the accuracy of the forecast would depend on this input data. As data is rarely perfect, it’s important to investigate the forecast and understand the applicability of it in the case of your specific data. There are several things you can do in order to understand how accurately your data is being forecasted:
Look at the width of the confidence interval that was described above.
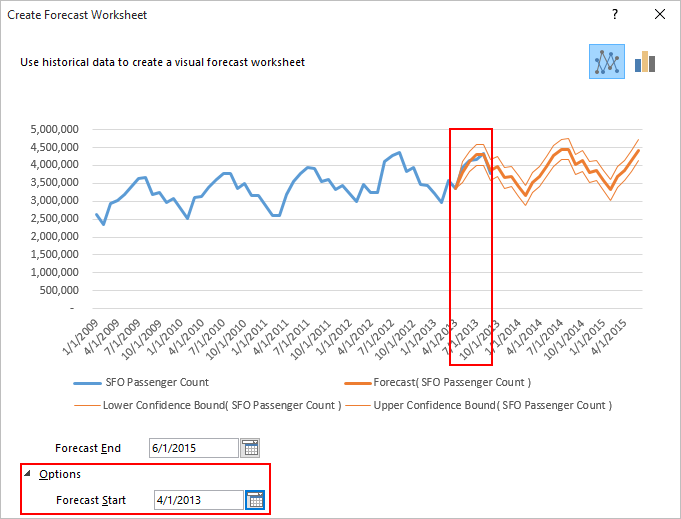
Experiment with the Forecast From control by setting it to a date earlier than your last historical point. This allows you to see how your prediction would have looked had it been calculated only over the earlier subset. In this case, you can look at the overlap between the forecast series and the actual series and see how close it was.
This is marked in red in the example below, and we can see that the prediction was very close to the actuals.
In this case the same can be achieved using the sheet functions by providing as input only part of the historical series and then comparing the forecast with the actuals.
If you happen to know your way around statistics, check the Include forecast statistics checkbox to display a summary of several accuracy metrics.
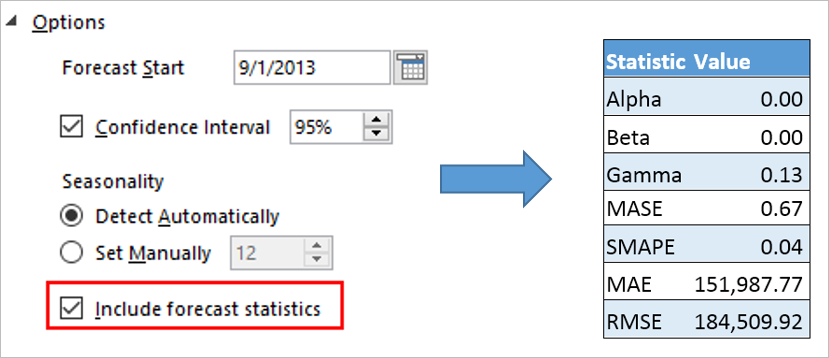
Select Include forecast statistics to display a table of statistical values in the forecast.
All of the statistics are computed using the FORECAST.ETS.STAT() function and described here.
What do you think?
We just went through the basics of the new forecasting features available in Excel 2016.