
Tackling corruption with transparency and technology

People can’t make sense of data they can’t see or readily understand, and it can be hard to trust automated insights that can’t be verified. This is where tools for visual data analysis, like Power BI (a data visualization solution), can make a difference. By making both input data and derived insights visible and navigable by a broader array of stakeholders – not just data scientists – such data tools can bring unprecedented transparency to the activities behind the data.
Our previous extensions of Power BI to support analysis of unstructured text, media, and meta-data, provided a readymade collection of visuals with which to represent and explore the networks of suppliers awarded public contracts. Similarly, our open source library for graph statistics, developed in collaboration with Johns Hopkins University, offered the algorithms we needed to model these networks, predict unobserved links between suppliers, and identify anomalous changes in activity over time. Using a copy of an actual supplier network dataset, we were therefore able to create an initial proof-of-concept more quickly and easily than in the past, requiring only a few days of development time and several hundred lines of original code.
This kind of speed is important, as it offers the potential for very rapid feedback and many cycles of design iteration. Arriving at the first meeting with a partner after they have shared a dataset with you – not just with a list of questions, but with a proof-of-concept solution – can fundamentally change the nature of the conversation. Although the first version will not be complete, or even correct in many cases, it demonstrates a bias for action, an ability to adapt quickly, and the art of the possible.
Another benefit of working with the same set of capabilities across multiple partners and datasets – like understanding public procurement from the perspective of both the World Bank and IDB – is that it helps to reveal the core structure of the problem, which often doesn’t change across contexts and use cases. This can give us the evidence we need to invest beyond the proof-of-concept stage and develop solutions that are usable and effective in real-world scenarios.
For our current work, potential user groups include governments, journalists, investigators, suppliers themselves, academics, and the general public. Ultimately, these audiences might benefit from different views of the same data, based on distinct roles, responsibilities, and interests. This is where the advantage of using an industry-standard application platform like Power BI comes in – not only does it enable rapid prototyping in the initial stages of development, it also is available for extension and customization by end users – all in a code-free way that may be broadly accessed.
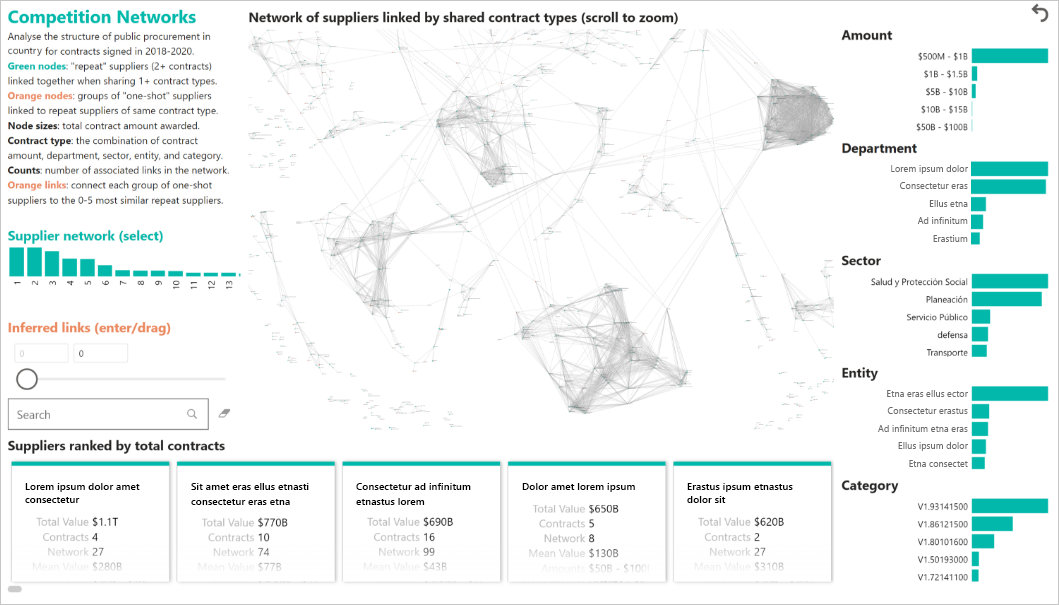
Figure 1 Above: Connecting suppliers who are awarded similar contracts reveals the implicit structure of competition across many overlapping markets. In this example, we are using a new tool developed in Power BI to explore the implicit structure of public procurement in Colombia from 2018 to 2020 for all awarded contracts over COP $1B (about USD $300k). The source data is available here and is the same data driving the Mapa Colombia application here.
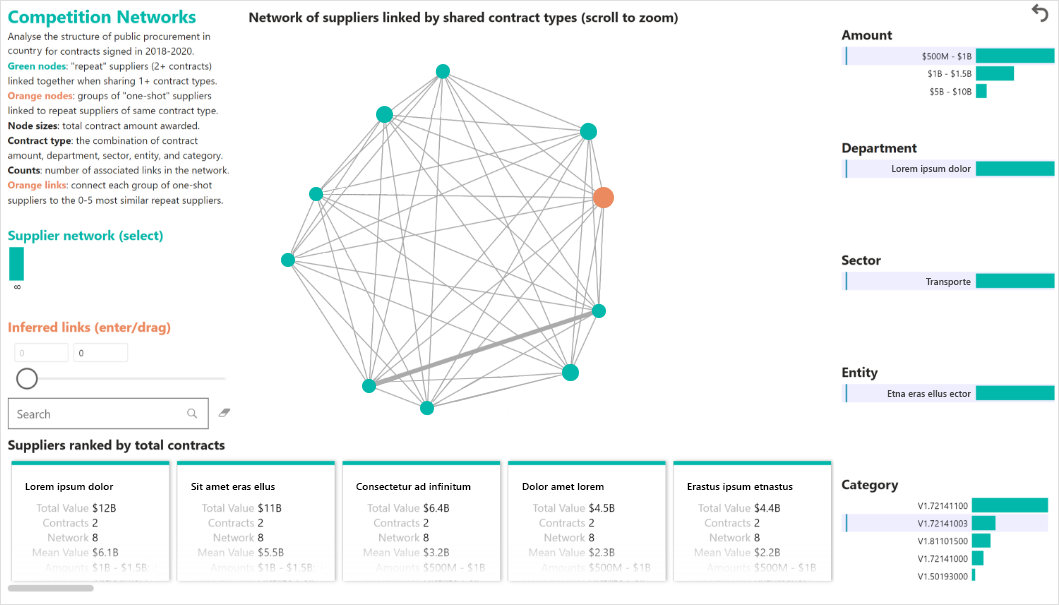
Figure 2 Above: A contract type is defined as a given combination of Amount awarded, awarding Sector, Department, and Entity, and Category of goods/services (e.g., Category V1.72141003 selected here represents street and road maintenance services). Making selections that drill down to a single contract type reveals a clique of suppliers (all in “Network 8”) that are related to one another by that contact type, as shown here. The thick gray line between the two green nodes represents many shared contract types between “repeat suppliers” winning multiple contracts over time. The large orange node represents a group of 39 “one-shot suppliers” each awarded just a single contract, with the total value of these contracts – $72.7B – ranking 72nd among such groups (hence the name “G72”).
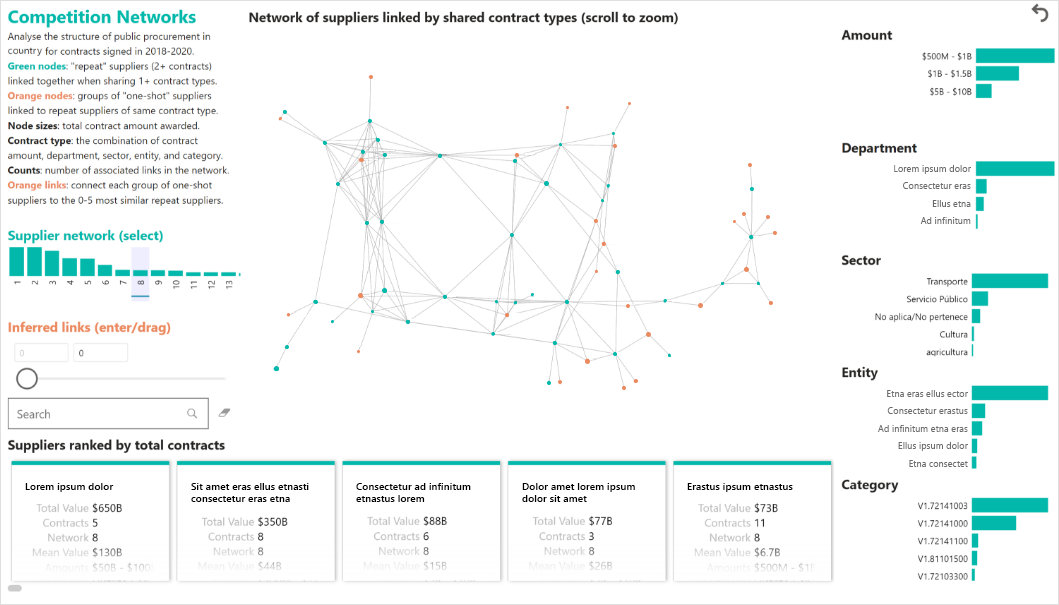
Figure 3 Above: Selecting a supplier network directly (“Network 8”, containing the contract type selected in the last example) shows how multiple suppliers competing for multiple overlapping contract types form a rich network structure spanning multiple Amounts, Departments, Sectors, Entities, and Categories. This particular network has a high proportion of “one-shot” supplier groups, shown as orange nodes. “One shot” suppliers have one contract across all entities/departments in the data. While such activity is normal in most cases, these organizations merit special attention since there are cases where organizations with these characteristics disappear without a trace after they are awarded funds.
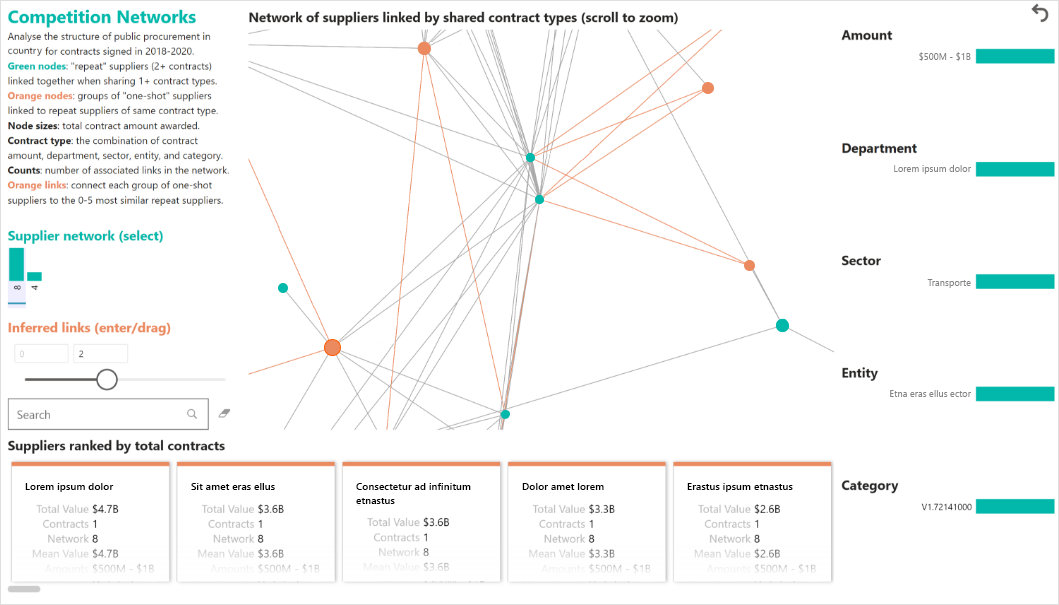
Figure 4 Above: Modelling supplier relationships in this way is often sufficient to connect “one-shot” suppliers to the closest repeat suppliers. In an experiment assigning 50 percent of each established supplier’s contracts to fictional one-shot suppliers, this network modelling recovered 67 percent of the actual–fictional supplier relationships. A further nine percent were recovered using graph statistics to infer an additional five links per one-shot supplier group, purely based on the network structure. The example shows two such “Inferred links” per group, added in orange, as well as the 127 suppliers in the selected “G22” group associated with $173B of contracts with Category V1.72141000 – highway and road construction. To identify and tackle corruption, this combined approach could potentially the capture the majority of cases where an established supplier posed as a new supplier as a cover for corrupt contract awards, whether or not they previously competed for that precise contract type.
We are still at an early stage in our explorations, but our proof-of-concept is already proving successful at transforming the kinds of conversations we have with IDB and our broader partners in the anti-corruption space.
When addressing a problem like corruption, our work demonstrates why technologies that advance transparency are a centerpiece of Microsoft ACTS. Our partnerships further accelerate the journey from prototype to practice.

Darren Edge
Director
Microsoft Research Special Projects