On-premises data gateway May 2019 update is now available
We are happy to announce that we have just released the May update for the On-premises data gateway (version 3000.5.185).
Here are some of the things that we would like to highlight with this month’s release:
- Gateway Performance Monitoring (Public Preview)
- May version of the mashup engine
Gateway Performance Monitoring (Public Preview)
We are excited to release this new feature for monitoring gateway usage and performance. Traditionally, for monitoring performance, gateway admins have had to depend on manually monitoring performance counters through the Windows Performance Monitor tool. This feature is an out of the box feature which includes additional logging regarding queries and system counters along with a Gateway Performance PBI template file to visualize these. This would insights into gateway usage and allow troubleshooting slow performing queries.
Note: this feature is currently available only for the On-premises data gateway in the standard mode and not for the personal mode.
When you turn this feature on, 3 new log files would be created:
- Query Execution Report – Contains detailed query execution information.
- Query Execution Aggregation Report – Contains query information aggregated to a time interval. The default value is 5 minutes but can be adjusted as described below.
- System Counter Aggregation Report – Contains system counter values aggregated to a time interval. The default value is 5 minutes but can be adjusted as described below.
To enable this feature, please make the following changes to the Microsoft.PowerBI.DataMovement.Pipeline.GatewayCore.dll.config file in the “\Program Files\On-premises data gateway” folder
- QueryExecutionReportOn – This attribute when updated to “True” enables additional logging for queries executed using the gateway and would create both the Query Execution and the Query Execution Aggregation Report files.
<setting name="QueryExecutionReportOn" serializeAs="String">

<value>True</value>

</setting>
- Set SystemCounterReportOn – This attribute when updated to “True” enables additional logging for memory and CPU system counters and would create the System Counter Aggregation Report
<setting name="SystemCounterReportOn" serializeAs="String">

<value>True</value>

</setting>
Other values in the config file related to this feature which may be of interest to you would be:
- ReportFilePath – Determines the path where the 3 new log files get stored using the attribute. This is by default the “\Users\PBIEgwService\AppData\Local\Microsoft\On-premises data gateway\Report” or “Windows\ServiceProfiles\PBIEgwService\AppData\Local\Microsoft\On-premises data gateway\Report” depending on the OS version. The PBIEgwService may need to be replaced with the service account running the data gateway.
- ReportFileCount – Determines the number of log files of each kind to be retained. The default value is 10.
- ReportFileSizeInBytes – Determines the size of the file to be maintained. The default value is 104857600.
- QuerExecutionAggregationTimeInMinutes – Determines the number of minutes for which the query execution information would be aggregated. The default value is 5.
- SystemCounterAggregationTimeInMinutes – Determines the number of minutes for which the system counters would be aggregated. The default value is 5.
Once you have made the above changes to the config file, do not forget to restart the gateway for these config values to take effect. You will now start seeing the report files getting generated in the ReportFilePath.
Note: Please wait for 5 minutes until the aggregate files get created in the ReportFilePath folder.
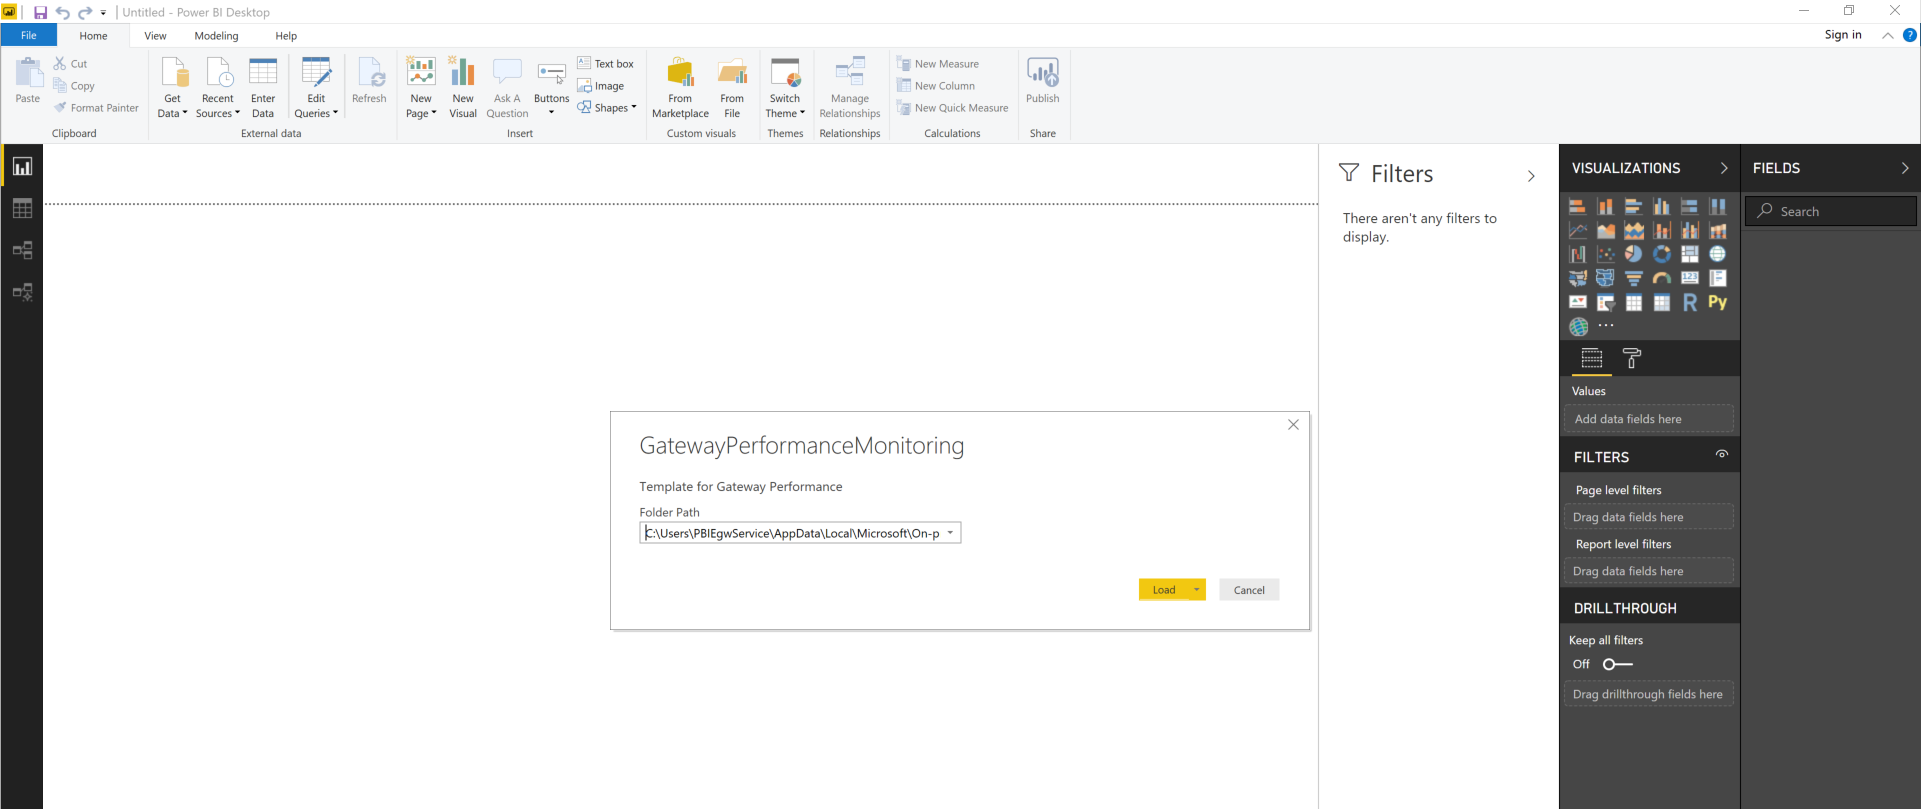
Now, to visualize this data download the Gateway Performance PBI template file and open it using Power BI desktop. You should see a pop-up for the Folder path. Please make sure this is the same as the value in ReportFilePath.

Click on Load and the template file would now start loading the data from your log files. All visuals should then be populated using the data in the reports. You can save this file as a PBIX and publish it to your service for automatic refreshes. Additionally, you could also customize this template file to suit your needs. Do provide any feedback on this new feature and any additional visuals which you would want us to add to the template.
May version of the mashup engine
This month’s Gateway update also includes an updated version of the Mashup Engine.
Last month, we also made available along with the latest gateway download, the previous 4 monthly gateway updates. This will make rolling back to an older version easier in case of issues/exceptions. This will also aid with troubleshooting.
Please note that this upcoming changes may impact you:
We would be using .NET 4.7.2 framework for gateways July 2019 version or higher hence some of the operating systems we used to support may no longer be supported. More information about OS which will be supported here.
Please continue to send us feedback for what new capabilities you’d like to see in the future.


