

At a glance
- We construct geographically grounded, electrically coherent power grid models entirely from publicly available data and release a dataset spanning 48 U.S. states and multi-state interconnections.
- The models support AC optimal power flow (AC‑OPF) analysis, enabling physics-based study of congestion, capacity, and demand siting without restricted data.
- We demonstrate applications including transmission expansion potential, targeted line upgrades, and placement of large datacenter loads.
Microsoft Research is excited to release an open dataset of approximate transmission topology of the U.S. power grid derived from publicly available data.
The ability to study transmission-level power grid behavior is essential for modern power systems research. Analyses of congestion, transmission expansion, demand growth, and system resilience all depend on network models with realistic topology, electrical parameters, and geographic grounding.
In most of the world, including the United States, realistic transmission-level grid data is classified as critical infrastructure information and subject to strict access controls. These restrictions exist for good reasons, but the resulting lack of realistic grid models is increasingly exacerbating the challenges power systems face. Decisions about where new load can be added – and how additional transmission assets can be deployed to support it – are often gated behind lengthy and opaque processes that can take years. For researchers developing new tools and algorithms, access typically requires long approval cycles, strict non-redistribution agreements, or costly commercial licenses.
PODCAST SERIES

The AI Revolution in Medicine, Revisited
Join Microsoft’s Peter Lee on a journey to discover how AI is impacting healthcare and what it means for the future of medicine.
As a result, many are left choosing between small “toy” networks with dozens of buses, or synthetic models that do not correspond to real infrastructure. This lack of realistic, shareable models is particularly limiting for data-driven and AI-based approaches, which require large volumes of physically plausible grid data for training and evaluation methods for grid analysis and planning.
Against this backdrop, a natural question arises:
Can we meaningfully understand how the U.S. power grid responds to modern stresses – and facilitate the development of actionable solutions for the system – using only open data?
In this work, we introduce an open-data-derived pipeline for constructing large-scale, transmission-level power grid models that realistically approximate existing networks without relying on proprietary or restricted datasets. We provide an open dataset derived from this process, consisting of transmission-level models spanning 48 U.S. states as well as interconnection-scale networks, ranging in size from small systems with as few as 11 buses to the full Eastern Interconnection grid connecting 21,697 buses. The pipeline has been validated across the continental United States, where sufficient open geographic, energy, and demographic data are available, and is designed to generalize to other regions with comparable public data sources.
Using only publicly accessible datasets, the pipeline produces geographically grounded, electrically coherent transmission models at state, multi-state, and interconnection scales. These models preserve the geographic structure of transmission corridors, substations, and generators inferred from open data, while explicitly accounting for uncertainty where detailed operational parameters are unavailable through transparent feasibility reporting.
Importantly, these are not toy networks or abstract benchmarks. The resulting models support alternating current optimal power flow (AC-OPF) analysis across a wide range of scales, enabling physics-based investigation of questions such as where transmission capacity is physically constrained; where new demand can be absorbed; and how infrastructure changes propagate through realistic network layouts – using only open data.
In this post, we describe the approach at a high level and highlight the system level questions it enables.
How the pipeline works
The pipeline turns publicly available geographic and energy data into transmission-level grid models that are geographically grounded and usable for power flow analysis.
The starting point is OpenStreetMap (opens in new tab), which encodes the physical layout of transmission corridors, substations, and power plants. This geographic skeleton is then augmented with open datasets describing generation capacity, fuel mix, demand, and operational boundaries (including U.S. EIA energy statistics and U.S. Census data), allowing the models to go beyond topology and represent how electricity is produced and consumed.
The key test is solvability. In power system analysis, solving optimal power flow (OPF) problems is a practical check on whether a network description is electrically coherent and practically relevant. OPF determines how generation can be dispatched to meet demand while respecting physical constraints such as transmission line capacities, voltage limits, and generator capabilities. Many inferred or synthetic networks fail this test outright: the topology may appear roughly correct, but other important engineering parameters are not.
Crucially, this approach moves beyond small benchmark or “toy” networks. In particular, we solve AC-OPF across the entire Eastern Interconnection, spanning 36 states and more than 20,000 buses, derived exclusively from public data sources. This demonstrates that open-data-derived models can produce convergent AC-OPF solutions at a continental scale.
To be clear, these models are not exact replicas of the operational grid, nor are they intended for market forecasting or real-time operational decision making by power balancing authorities. Electrical parameters are estimated from standard engineering references, parallel circuits are approximated rather than exhaustively enumerated, and demand is allocated using public proxies derived from open data.
The goal is to produce structurally and electrically realistic models that preserve geographic structure and scale from individual states to large multi-region systems using only open data. Full methodological details, validation results, and limitations are described in a companion research paper.
Why this matters for today’s energy challenges
Access to solvable, geographically grounded grid models unlocks questions that have become increasingly urgent as the energy system evolves, driven by large-scale datacenters, AI workloads, renewable generation, and extreme weather events. We illustrate these capabilities with concrete analyses on models derived from our pipeline.
Where can new transmission physically fit?
Before asking how much new capacity the grid needs, planners must first ask where more wires are even possible. Transmission corridors have a physical limit on how many circuits they can carry: each circuit requires three conductors, and most tower structures accommodate one to three circuits (three to nine conductors). Beyond that, adding capacity typically requires acquiring entirely new rights-of-way – which is expensive, legally complex, and often politically infeasible in urban areas.
Because our models preserve the geographic structure of real transmission corridors from OpenStreetMap, we can count the number of parallel circuits along each path and visualize where the grid is already physically saturated.


Identifying where the grid is physically boxed in, regardless of generation or demand, is not an optimization problem. It is a spatial feasibility question that geographically grounded models are uniquely positioned to answer.
What if we add capacity where it is needed most?
In dense urban areas, adding new traditional transmission lines is often impractical. The combination of tightly packed buildings, roadways, and complex underground infrastructure leaves little room to establish rights-of-way for high-voltage lines. Alternative power‑transmission solutions are sometimes explored to support urban grid expansion. For example, high-temperature superconducting (HTS) cable systems offer an order-of-magnitude higher ampacity for a given cross-section, enabling the transfer of large amounts of power at lower voltages and simplifying permitting requirements.
Short point-to-point superconducting power links have already been demonstrated in U.S. cities: Columbus, Ohio, Albany, New York, Long Island, New York (decommissioned), and Chicago (operational).
To explore what such connections might accomplish, we modeled two hypothetical HTS links in the Massachusetts grid, each connecting a substation northwest of Boston to load centers closer to the city. We then re-solved AC-OPF and compared the results to the unmodified baseline.


This is precisely the kind of insight that publicly available price data cannot provide. Wholesale electricity prices reflect whether congestion exists, but not how close the system is to congestion nor how power flows change when new assets are added. A line operating at 95% of its thermal limit and one at 50% look identical in market data – until one of them reaches capacity. Physics-based models expose that margin directly, making it possible to evaluate interventions before they are built.
Where should new demand go?
Rapid growth in electricity demand raises a question that existing market signals answer poorly: where on the network can new consumption be absorbed without triggering congestion?
Wholesale electricity prices reflect marginal generation costs, current congestion patterns in the transmission grid, and transmission losses, which are typically small – but they do not capture how close the system is to its limits. Siting decisions based solely on price therefore miss the physical margin that determines whether new demand can be served without infrastructure upgrades.
To illustrate this, we placed the same hypothetical 500 MW datacenter at two locations in the Maryland grid and re-solved AC-OPF for each (locations were chosen arbitrarily and do not reflect Microsoft’s datacenter portfolio or expansion plans). The two sites are plausible alternatives from a market perspective, with similar population density, comparable electricity prices, and proximity to major load centers:
- Site A (Baltimore area): a substation in the Baltimore metropolitan region, near an existing generation complex and dense transmission infrastructure
- Site B (Washington, DC suburbs): a substation in Montgomery County, serving a similarly dense suburban area within the Washington–Baltimore corridor
Despite these similarities, the physical outcomes differ. Adding the datacenter at Site A pushes a nearby transmission line into thermal overload, while placing the same load at Site B is absorbed by the existing network without violating line limits. The two sites are less than 50 miles apart, yet one would require transmission reinforcement and the other would not.
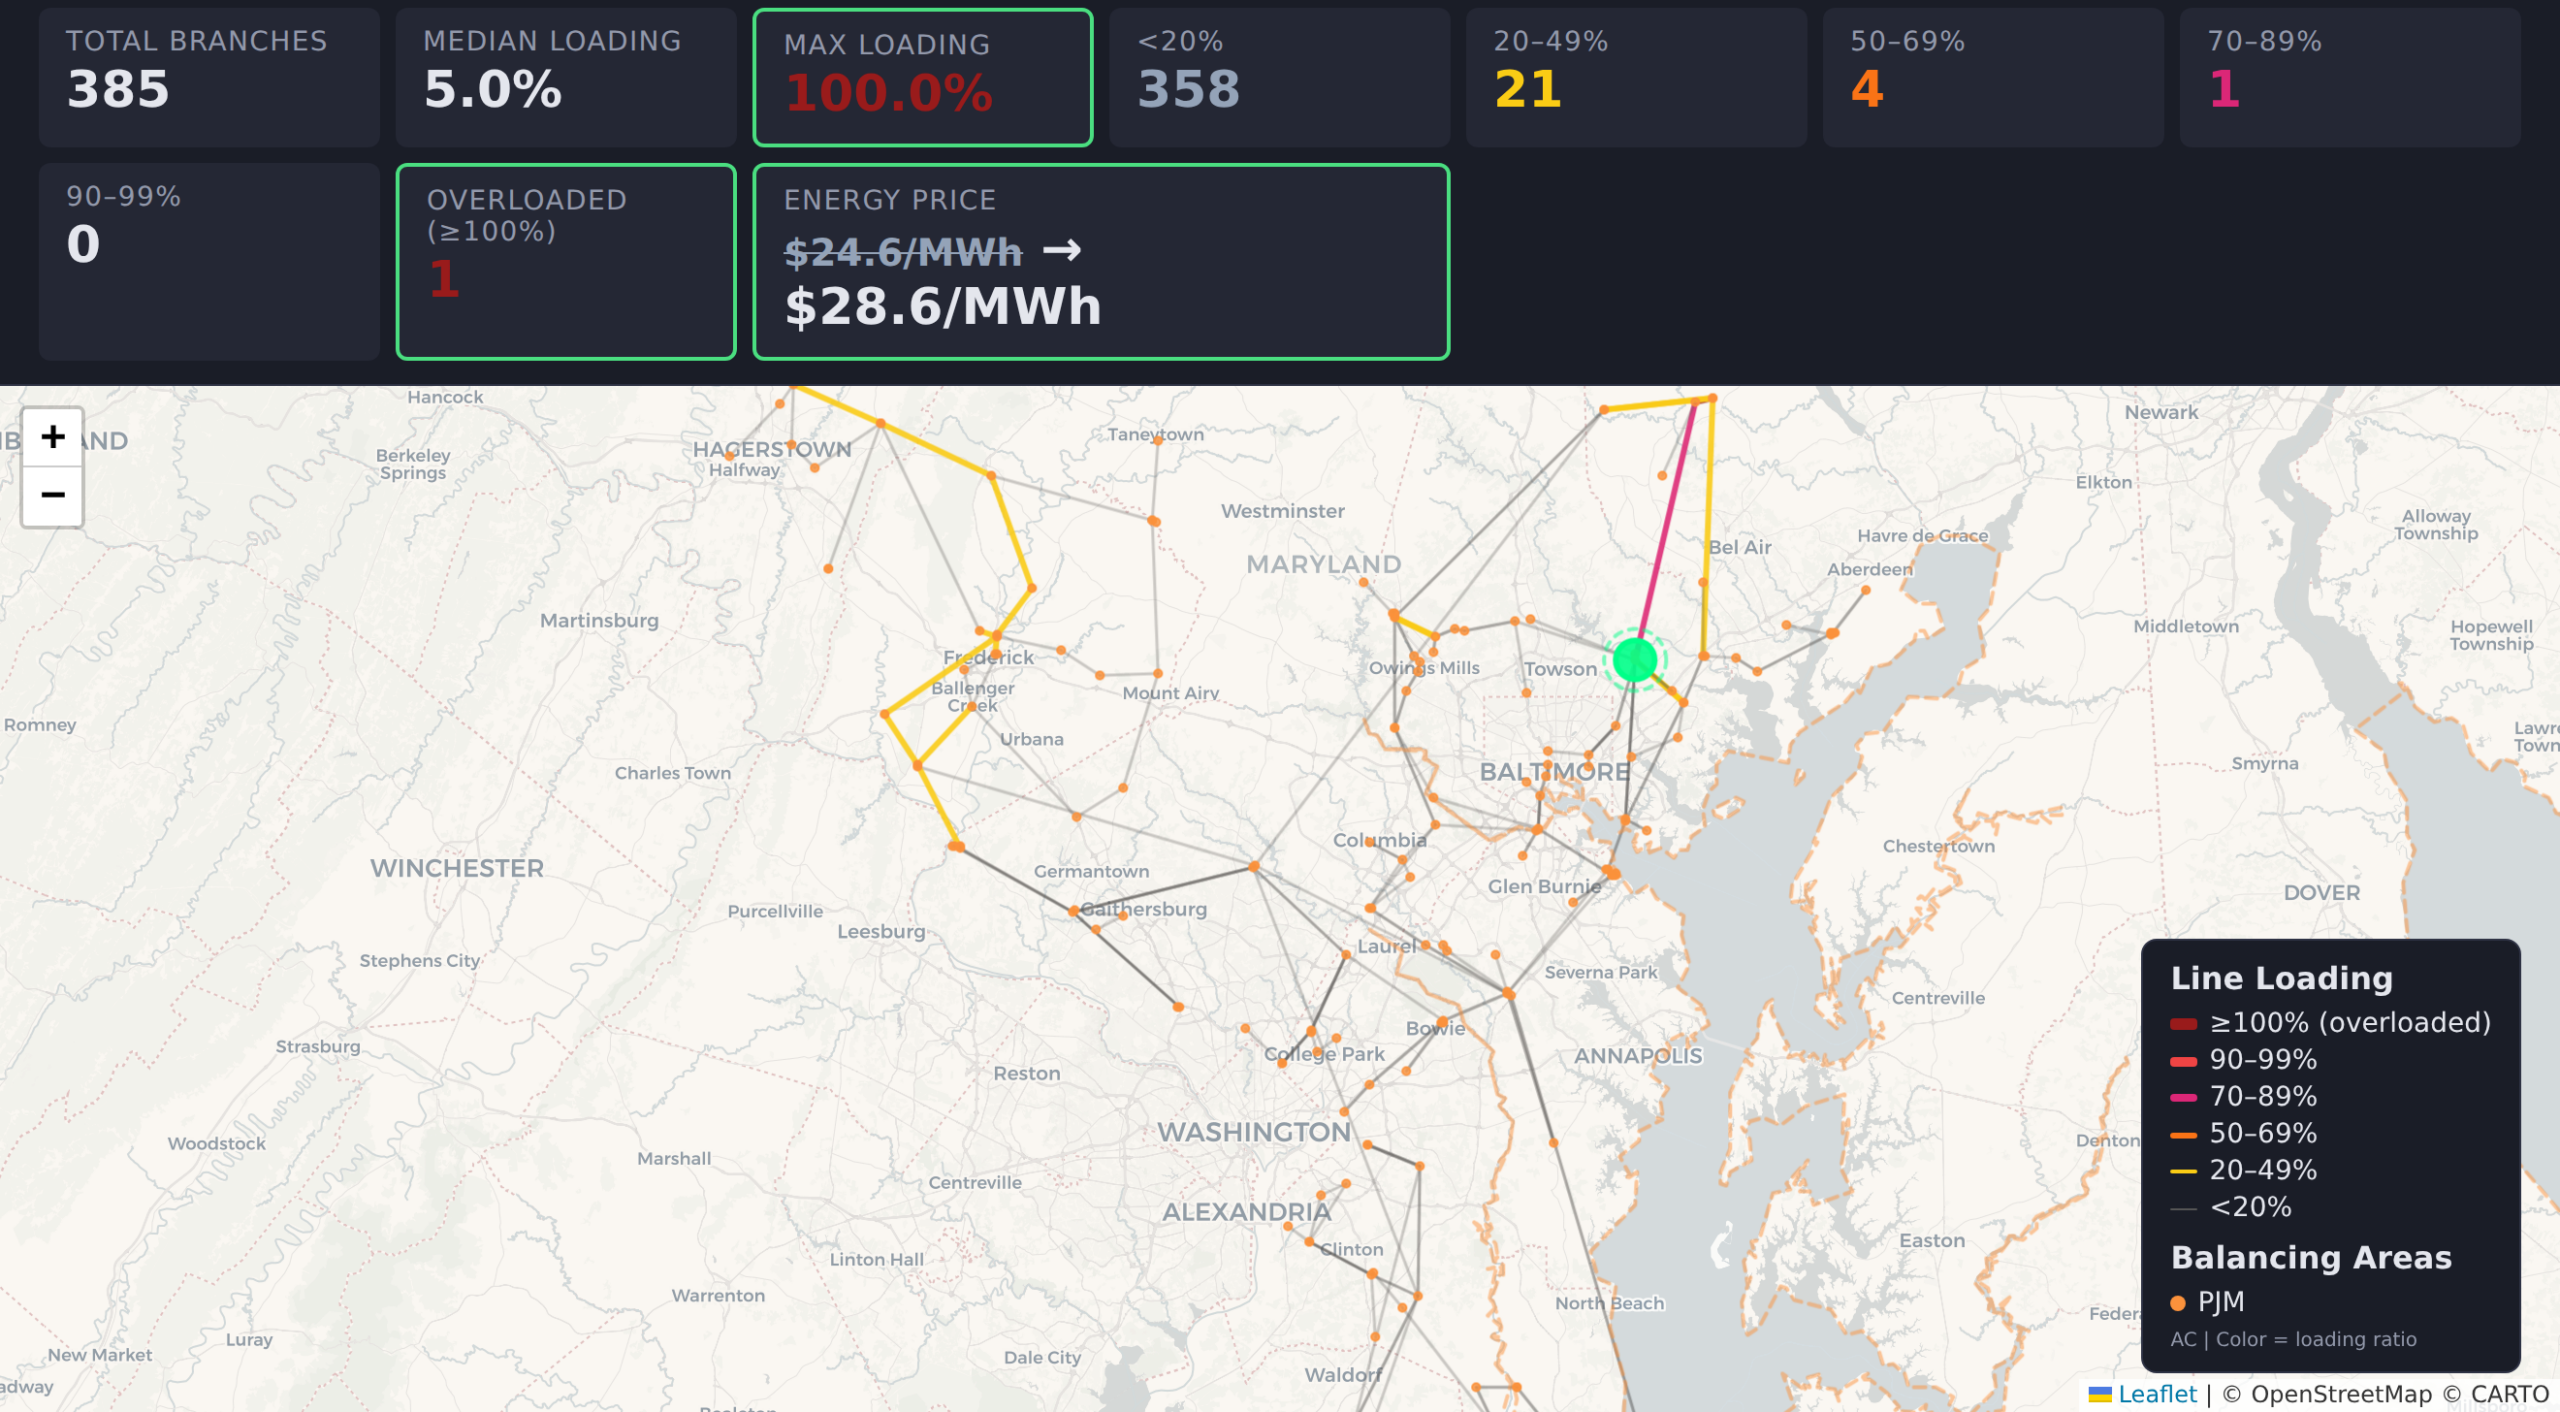

This distinction – largely invisible in price data – emerges directly from a more direct first-principle transmission-level power flow analysis. It highlights why geographically grounded, physics-based models are necessary for demand-siting decisions in a stressed grid.
Looking ahead
This work shows that it is possible to study transmission-level grid behavior at realistic scales without access to restricted infrastructure data. By grounding models in real geography and making uncertainty explicit, open-data-derived grids can support analyses that are difficult or impossible with small benchmarks or purely synthetic networks.
While the examples here focus on the United States, the approach generalizes to other regions where comparable open data is available. More broadly, we see this capability as an enabling layer: a way to improve the study of congestion, feasibility, and system stress – whether for planning studies, scenario analysis, or data-driven methods that require realistic grid structure.
We are releasing an open dataset of grid models spanning 48 U.S. states and six multi-state interconnections, ranging from small systems with tens of buses to continental-scale networks. All models can be solved under AC-OPF, with controlled relaxations applied when necessary to account for uncertainty in open data inputs. These models are solved for both peak and off-peak demand conditions, enabling consistent analysis across a range of operating scenarios.
This post is the first in a two-part series. In the second post, we introduce GridSFM, a learning-based AC-OPF surrogate trained on these grid models. We show how it predicts a full AC operating point in milliseconds, classifies feasibility for fast screening at planning scale, and serves as a warm-start seed that accelerates downstream numerical solvers.