Reasoning about figures
Almost every scientific publication is accompanied by data visualizations in the form of graphs and charts. Figures are an intuitive aid for understanding the content of documents, so naturally, it is useful to leverage this visual information for machine reading comprehension.
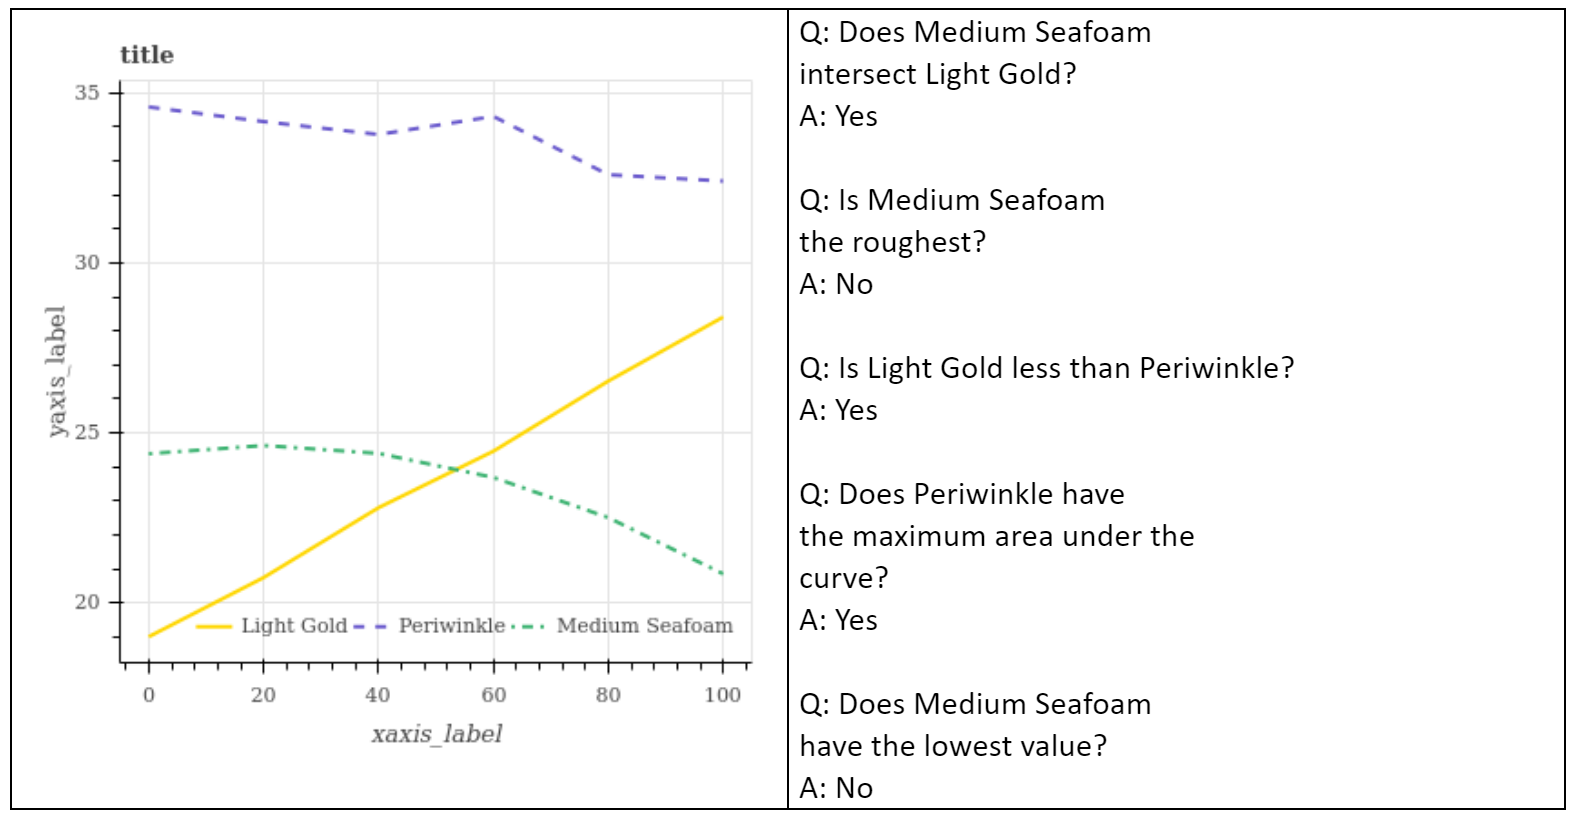
To enable research in this domain we built FigureQA (opens in new tab), a new dataset composed of figure images – like bar graphs, line plots, and pie charts – and question and answer pairs about them. We introduce this dataset and the task of answering questions about figures to test the limits of existing visual reasoning algorithms, as well as to encourage the development of new models that can understand qualities and relations that are intuitive for humans.
Figure 1: A sample line plot with some questions and answers taken from FigureQA
Spotlight: AI-POWERED EXPERIENCE

Microsoft research copilot experience
Discover more about research at Microsoft through our AI-powered experience
Motivation
FigureQA and the task it introduces align with the research domains of visual question answering and reasoning. Visual question answering (VQA) involves studying an image and question to produce an answer; this requires a joint understanding of images and language to achieve visual comprehension. Our research and dataset focus on relational reasoning, which aims at discovering relationships between abstract properties of elements in an image.
A number of visual question answering and reasoning datasets have been published before FigureQA. Some datasets, like the one introduced with the VQA challenge [1,3], contain photographs or artificial scenes mimicking the real world. These images are accompanied by open-ended, yes-no, or multiple-choice questions that were collected from humans. The high variety in these datasets makes them useful for general visual question answering, but not suited for sophisticated reasoning. Complex scenes require a large amount of common sense knowledge about the world. Acquiring such common sense knowledge does not seem possible given only a VQA dataset.
For models to focus more on reasoning, it is necessary to train on datasets having more restricted and specialized properties. A number of published datasets including NLVR [10] and CLEVR [5] achieve this by generating the sample images with a program, rather than annotating natural images. These datasets consist of images with simple geometric elements set in a basic scene, as well as questions that compare these elements based on properties like size, count, and spatial relationships. While such datasets are much better for testing the reasoning abilities of models, they are composed of toy scenes that do not capture the complexity of the real world.
We also note that FigureQA is not the first figure dataset to be published. Existing figure datasets consist of images scraped from research papers with human-annotated plot types, bounding boxes, or values [8]; similar synthetically generated datasets also exist [2]. These datasets are suitable for the tasks of plot classification, extracting plot values, and optical character recognition (OCR), but not visual reasoning due to their lack of questions and answers.
Dataset description
FigureQA was created to develop deep neural network models that are capable of visual reasoning and can also be applied to a domain of real-world data: graphical figures. Our dataset is generated entirely by a program and has 180,000 images with over two million questions. Except for the test set which is used for evaluation, answers are also provided.
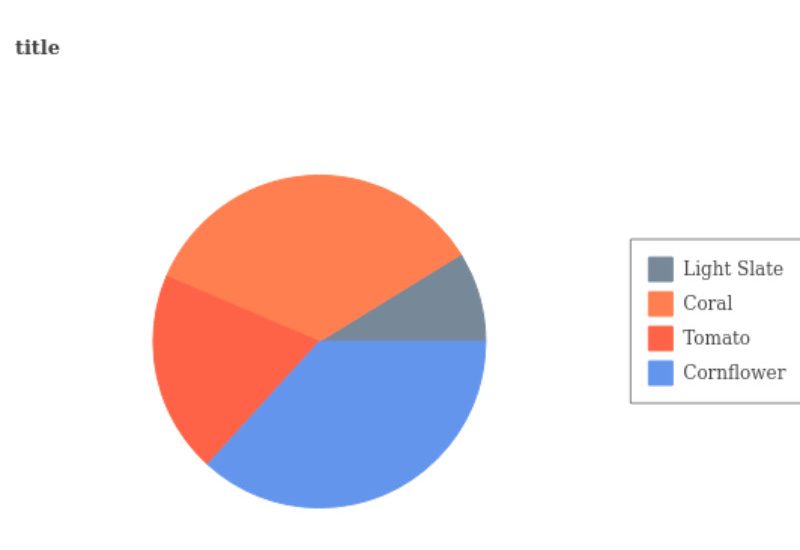
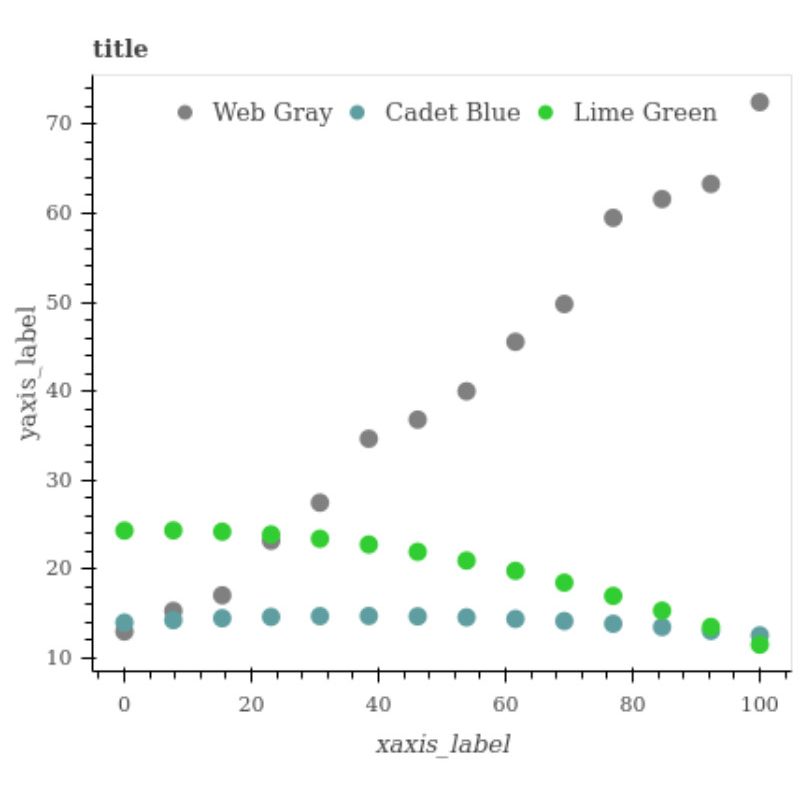
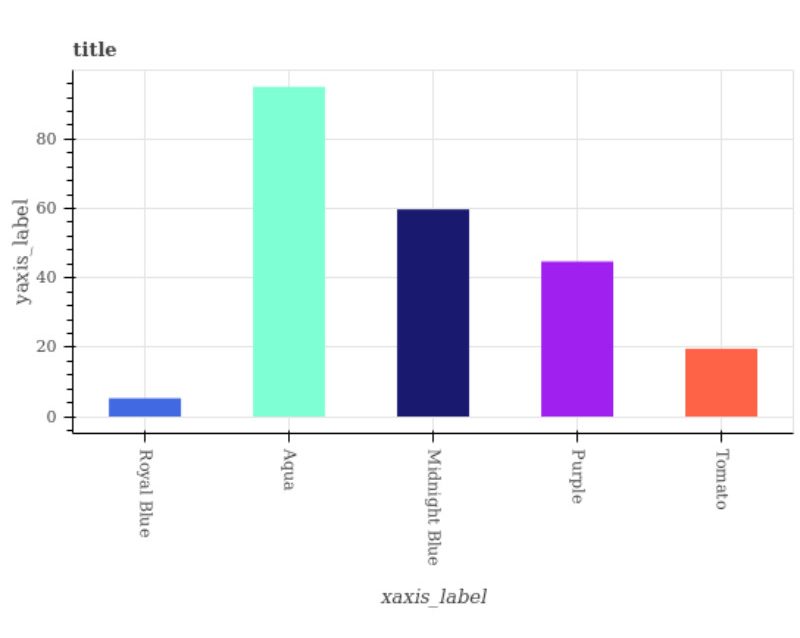
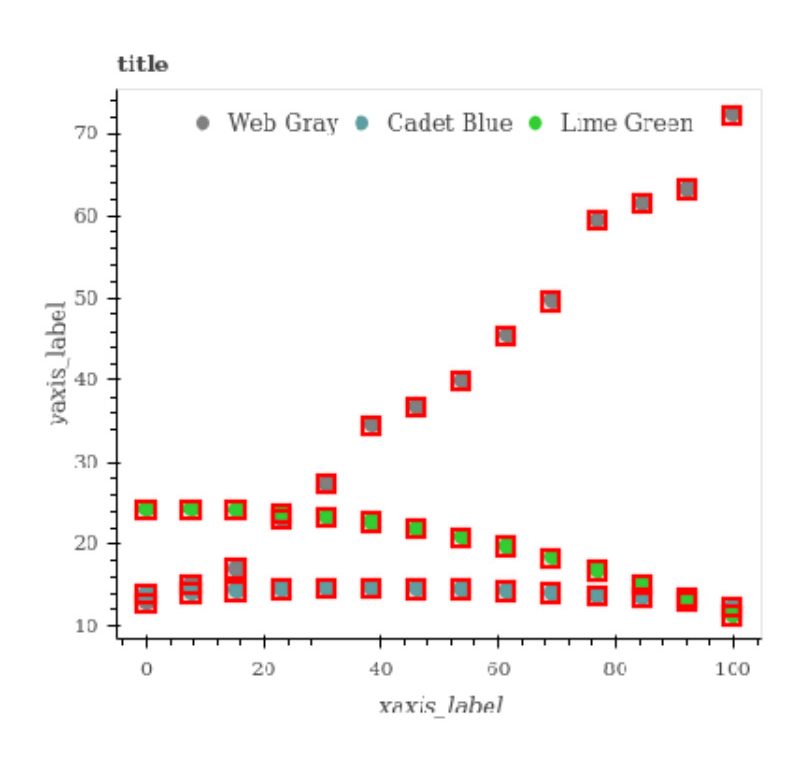
We selected five types of figures commonly found in analytical reports and documents for our dataset, namely: vertical and horizontal bar graphs, line and dotted line plots, and pie charts. The figures were generated randomly using some pre-defined distributions and constraints to ensure a large amount of variety, while making sure they appeared realistic.
Figure 2: Examples of each figure type


Fifteen types of questions concerning the figures were chosen for the dataset, addressing quantitative relational properties of the plot elements. These questions are generated from pre-defined templates and all have yes or no answers. The answers are computed by evaluating the questions on the source data used to synthesize each figure.
The questions in FigureQA ask about one-versus-all characteristics of the figures, like which plot elements are or contain the maximum, minimum, or median values. We also generate questions that compare two plot elements, for example whether one pie slice is larger than another, or if two curves intersect. As an extra challenge for line plots, we also formulate questions regarding the smoothness of curves and the area contained under the curve.
Table 1: All question types, where X and Y are plot elements.

One problem with existing visual question answering datasets is that they may have a skewed distribution of answers for a specific question or visual feature. It has been observed that models will identify this bias and exploit it, even to the point where they will ignore the image completely [3]. We took great care to de-bias our dataset by balancing the number of yes and no answers per question type, having many color combinations, and generating our source data randomly to ensure a high degree of visual variation.
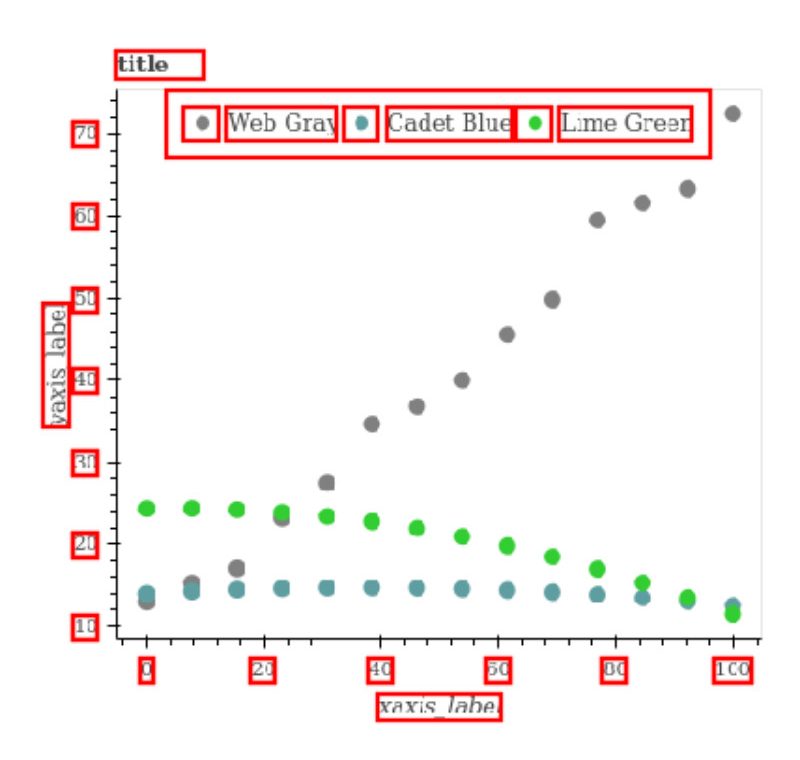
In addition to images, questions, and answers, for each figure we provide its source data and the bounding boxes for all the elements it contains. This allows the dataset to be extended to other types of questions and answers and provides visual features that are useful for developing models.
Figure 3: Dotted line plot with bounding boxes visualized
Experimental results
We developed FigureQA to be a challenging visual reasoning dataset, and this has been confirmed by the performance of our baseline models. We tested some common and advanced neural network models on our dataset, as well as the ability of people to answer the questions posed.
Table 2: overall baseline performance on the test set

Establishing a baseline for human performance on FigureQA was essential to benchmark our models. We tested our editorial team at the Montreal lab on a portion of our FigureQA test set and observed that humans performed exceptionally well on most figure and question types, though not perfect, reaching an overall accuracy of 91.21%. Line plots in general, median questions, and questions concerning roughness and smoothness were the most challenging.
The first models we evaluated our dataset on were more conventional deep neural network architectures, without more specialized neural units incorporated into them. We used a long short-term memory (LSTM) [4] to establish a baseline on question text only. We also combined the encoding from our text-only baseline with the representation produced by a convolutional neural network (CNN) [6] on the figure image as input to a multilayer perceptron (MLP) baseline. It is common in computer vision to leverage visual features from pre-trained CNNs. We also provide a CNN baseline that uses VGG-16 features [9] instead of raw pixels as input. Our results indicate that these models do not perform much better than a coin flip.
We also tested a recent advanced neural architecture called a relation network [7] on FigureQA. This model contains modules that are specialized for reasoning about the relationships between elements of an input image. Relation networks have achieved exceptional performance on tasks like visual reasoning on the CLEVR dataset, which makes this model suitable for evaluation purposes. The relation network did better than our two simpler models, with 61.54% accuracy overall, but still performed significantly worse than our human baseline.
Figure 4: Relation network architecture

Impact
The thirty-percent or greater gap in overall accuracy between our human benchmark and the neural models for visual reasoning we tested indicates that FigureQA is a challenging dataset for this task. Our results show that our dataset is very suitable for developing more powerful visual question answering and reasoning models, creating opportunities for research in this field.
FigureQA also provides another potential application for AI and how it can impact our work and lives. One could imagine how a tool to assess graphs and charts could automate decision-making processes or empower analysts.
We look forward to the research advances, models, and applications that come from our FigureQA dataset.
Related: