

At Microsoft, the trustworthiness of A/B test results is essential for data-driven decisions. In earlier parts of our trustworthy experimentation series, we shared patterns and some recommendations to increase trustworthiness in both pre- and during- experiment stages. Now we tackle the final stage in the experiment lifecycle. At this stage, the A/B test has concluded and we are set to make our ship decision. But how can we guarantee the trustworthiness of the results to make a sound ship decision? And how can we leverage one test to increase the trustworthiness of the A/B testing program as a whole?
In this blog post, we will share checks to identify issues that affect metric trustworthiness and to ensure accurate measurement of the overall impact of the treatment on the product. We also recommend post-experiment practices to make the A/B testing program more robust and trustworthy. Let’s dive right in!
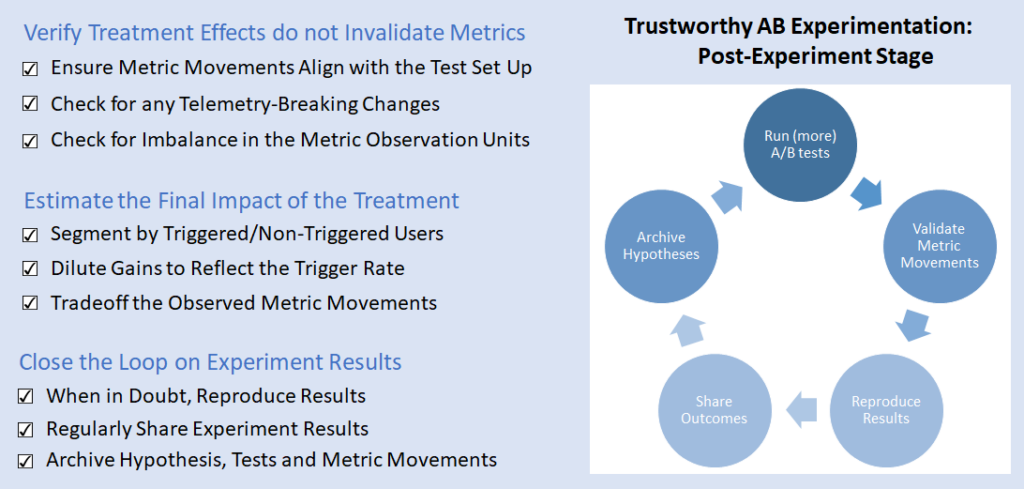
Figure 1: Post-Experiment Trustworthiness Patterns
Verify Treatment Effects do not Invalidate Metrics
When we design online A/B metrics, we assume that any unresolved data quality issues in the logs are equally distributed between treatment and control. However, if that assumption doesn’t hold in the A/B test, then the trustworthiness of the metrics is no longer guaranteed and any decision based on the test is no longer sound. In this section, we discuss how the quality and quantity of the data impact metric values and their interpretations.
P.S. Many metric interpretation pitfalls come up when analyzing A/B tests [1], but in the interest of brevity we will focus on three patterns that are generally applicable.
Ensure Metric Movements Align with the Test Set-Up
The first step in a trustworthy A/B test is to formulate a proper hypothesis. Next, we design, set up, and run the A/B test to validate the hypothesis. However, before making any decisions based on the observed metrics, we need to verify that the results align with the design decisions that we made earlier on.
We first check whether the characteristics of the users in the scorecard align with the intended population of the A/B test. Does the number of users in each variant align with the expected traffic allocation in the test? Do all users appearing in the scorecard belong to the target audience (e.g. market, browser, Insider status)?
Next, we check whether the change implemented in the treatment is reflected in the metrics. For each hypothesis, there are expected metric movements that we should see in the test results. If the treatment adds or removes an element of the product (e.g. a new answer is introduced in Bing), are coverage metrics increasing or decreasing as expected? If the treatment adds more content to a webpage, can we observe the corresponding impact in page size and load time?
If the answers to any of the above questions are “no”, then there might be issues in the test’s setup. We need to re-examine whether the engineering implementation reflects our intended design and quantify the impact of the flawed implementation on the observed results. Once we verify that the metrics are still trustworthy, we can then examine user metrics to better understand the treatment effect on user behavior.
Check for any Telemetry-Breaking Changes
When we design online metrics, we use signals constructed from the telemetry collected when users interact with the product. Some examples of signals include server requests, clicks, typed words, mouse scrolls, and voice utterances, among others. The validity of these signals depends on the quality of the logs collected. If there is a change in how logs are collected or what interaction they represent, the signals themselves will change. This can make the metrics based on them harder to interpret. This becomes particularly important in A/B tests when the changes in logging or telemetry impact one variant more than the other, which creates a bias in the A/B test.
Consider for instance the Skype A/B test mentioned in [1]. One unintended side effect of the change tested was improved reliability in call logging on treatment. This improved reliability was not the same on control. This discrepancy led to many unexpected metric movements that were hard to interpret or attribute to the intended effect of the treatment. Such telemetry-breaking changes can also show up in click logging reliability, click dwell time computation, and in how user input is logged and processed.
While it is difficult to completely avoid such unintended consequences in A/B tests, we can detect them by creating metrics to capture the reliability of the underlying signals. Such metrics fall under the Data Quality metric type we describe in the during-experiment stage and by computing them for every A/B test, we can identify trustworthiness issues in metrics attributable to telemetry changes.
Check for Imbalance in Metric Observation Units
Sample Ratio Mismatches (SRMs) have been extensively discussed in ExP’s blog posts. They are the earliest check on the validity of the scorecards and all the metrics computed. However, even if we don’t observe SRMs at the scorecard level, there might still be an imbalance at an individual metric level. This is particularly important when this imbalance is unexpected or obfuscated from the experimenter since it can lead to incorrect conclusions and wrong decisions.
A metric movement can be hard to interpret if the number of samples in its computation changes during the experiment. This is most evident in rate metrics that are computed as the ratio of a numerator and a denominator. The denominator itself is a stand-alone metric and when it moves stat-sig in an experiment, it can cause unexpected movements in the rate metric.
An interesting example comes up in [2], where the authors describe an A/B test from Bing where the objective is to measure user engagement in the form of clicks. As shown in Figure 2, depending on which denominator is used the metrics can move in contradictory directions or not at all. This can be very confusing for experimenters making ship decisions. Generally, the more fine-grained the denominator, the more likely we are to impact the metric in an A/B test [2]. However, that also increases the chance that the denominator moves on its own as well. Our guidance is to 1) create a separate metric for the denominator to test if it has moved in stat-sig way and 2) use the metric with the most fine-grained denominator where the denominator has no stat-sig movement. In the figure below that would be Clicks/Session.
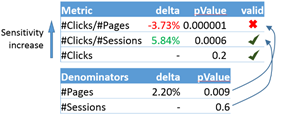
Figure 2: Denominator changes can lead to invalid and contradictory metric movements[2]
Estimate the Final Impact of the Treatment
Once an A/B test concludes and we verify that metric movements are trustworthy, we can analyze how the treatment impacts our user population and make a final decision about our hypothesis. To that end, we need to zoom in on our intended-to-treat population to increase the sensitivity of the measurement and to reduce noise from the unaffected population. To estimate the impact on the overall population (both intended-to-treat and unaffected users), we need to dilute the zoomed-in metric movements and make a ship decision based on the final diluted numbers.
Segment By Triggered/Non-Triggered Users
A standard practice in A/B testing is to generate a triggered analysis for an experiment [4,5]. A triggered analysis allows us to zoom in on the population directly affected by the treatment, which hence improves the sensitivity in metric computations. With proper counterfactual logging (as discussed in the the pre-experiment stage), we can determine whether a user in control would have seen the change if they were in the treatment . The trigger condition is a Boolean expression that correctly captures the counterfactual flag and identifies impacted users. For the weather answer example we described in our previous blog post, the trigger condition should capture: 1) all users in the treatment who issued queries where the weather answer was triggered, and 2) all users in the control who issued queries where the weather answer would have been triggered had they been in the treatment.
Triggered analysis focuses on impacted users by excluding those who did not meet the trigger condition. For users who did, the triggered analysis further excludes all user logs that occurred before the first event where the trigger condition was met. In this way, we are excluding user data that hasn’t been impacted by the A/B test and would only add noise to the analysis, if included. Figure 3 below shows the various analyses we recommend with a trigger condition.
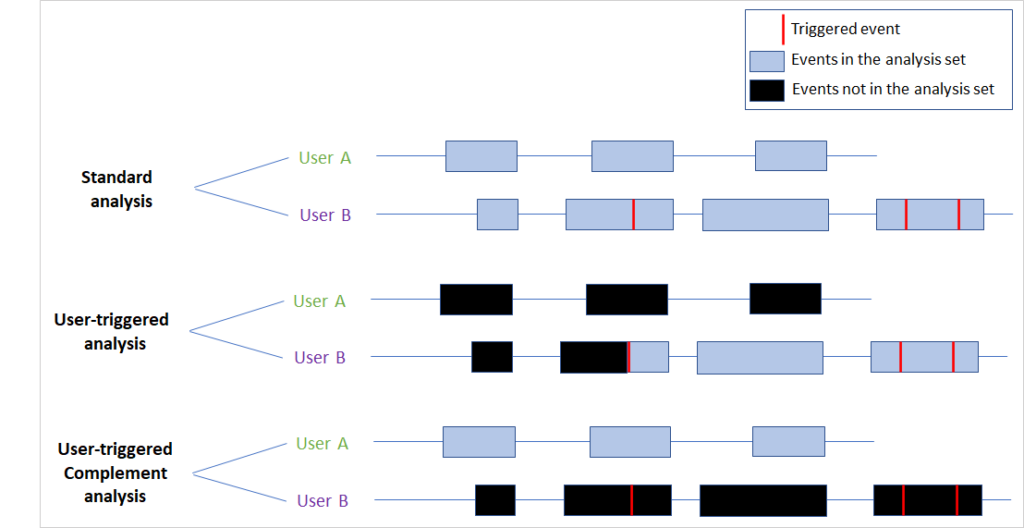
Figure 3: The various types of analysis to generate based on a trigger condition. The red lines represent the events where the trigger condition is true and the blue boxes represent a user’s events user during the A/B test. The standard analysis includes all users independent of having a triggered event. The user-triggered analysis only includes users like user B who have a triggered event and only includes events after the first triggered one. The user-triggered complement includes the complement of the triggered users in the standard analysis. A correct trigger condition implies that the user-triggered complement analysis should not detect any treatment effect.
However, one needs to be careful with triggered analysis since trigger conditions can be faulty if they exclude user data impacted by the A/B test. In fact, the trigger condition needs to have: (1) 100% recall in capturing users that were or would have been affected by the tested change and (2) high precision to achieve the highest increase in sensitivity.
To verify that the trigger condition is all-inclusive of the treatment effect and that counterfactual logging is done correctly: 1) verify that the triggered scorecard has no Sample Ratio Mismatch [6] and 2) generate a triggered-complement analysis (an analysis that includes only the users that did not satisfy the trigger condition) and confirm that it looks like an A/A. In particular, the feature-level metrics measuring the coverage of the feature being tested (based on which the trigger condition is created) and the top metrics used to make any ship decision should be flat.
Dilute Gains to Reflect the Trigger Rate
Triggered-user segmentation allows us to increase the sensitivity of the metrics and detect small changes measured directly on the intended-to-treat population. However, the delta observed in a triggered-user segment is not reflective of the delta you would observe in the overall user population once the change is shipped. Going back to the weather answer example from our pre-experiment patterns blog, the triggered users are only those who had queries with a weather intent and, therefore, do not reflect the overall user population of Bing.
To properly compute the overall impact of the change, we need to “dilute” the delta observed in the user-triggered analysis back to the overall standard population. There are two main requirements for dilution to apply in a specific A/B test: 1) There is a detectable statistically significant treatment effect in the metric when measured in the user-triggered analysis, and 2) there is no treatment effect detected in the triggered-complement user analysis.
There are few dilution methods described in the literature [5] and their applicability depends on the type of metric that we are trying to dilute. For count metrics (e.g. Sessions Per User), to approximate the diluted delta, all you need to do is multiply the user trigger rate (% of triggered users) by the relative delta observed in the user-triggered analysis.
The same approach is not correct for ratio metrics (e.g. Clickthrough Rate) since they don’t have the additive property of count metrics [5]. However, dilution for such metrics can be reduced to variance reduction for the metric from the standard analysis: as covariates, we use the value of the metric in the untriggered user population as well as the trigger rate. Deng and Hu explain this exact method in [5].
Tradeoff the Observed Metric Movements
Once you compute the final impact of the treatment on your metrics, you need to decide whether to ship the change or iterate on it. Sometimes, the metrics tell a clear story – that the treatment is clearly improving (or hurting) the user experience: the Overall Evaluation Criteria (OEC) is increasing (or decreasing) or it is flat -with an adequately powered A/B test- and the Guardrail metrics are improving (or regressing). In such cases, we can confidently recommend shipping (or not) the change being tested.
In other cases, the metric movements are not as conclusive. For example, consider a treatment where the OEC improves but we also observe a regression in one of the Guardrail metrics. One such treatment could enrich a webpage with content that is relevant to the user as seen in the OEC improving, but that added content causes the webpage to load slower, causing the Page Load Time (a Guardrail metric) to regress. How do we make a ship decision in this case? Is the improvement in the OEC enough to justify the regression in the Guardrail metric? This is a problem faced by many companies when they run A/B tests on their products [7]: How do you tradeoff movements between the key business metrics?
There is no standard way to evaluate those tradeoffs. One method used by Bing [7] is to assign different weights for the various metrics used to make a ship decision. The weights reflect the current business direction and growth maturity of the product, as well as how key metrics moved in historical A/B tests. Note that these weights should be pre-determined and not depend on the specific A/B test being analyzed. Once these tradeoffs are derived and agreed on by the whole organization, they can accelerate experimentation agility: experimenters now have the tools to independently make informed ship decisions for their A/B tests.
Close the Loop on Experiment Results
We are now close to the end of our experiment lifecycle. After inspecting our A/B test results, we make our ship decision and proceed to execute it. In this section, we recommend some follow-up actions to do before and after shipping a change to increase the trustworthiness of your current hypothesis, future hypotheses, and the whole A/B testing program in your organization.
When in Doubt, Reproduce Results
When a Bing engineering team wanted to change the drop-down menu that allows a user to filter results based on their creation date, they ran an A/B test to measure the impact of the change. Given the extremely low engagement the drop-down menu receives, the team did not expect any change in user satisfaction metrics. They ran the A/B test simply to verify that no unintended bugs or errors were introduced. However, after the metrics were computed, the team was surprised to see a very stat-sig improvement in user satisfaction metrics. Twyman’s Law [8] implies that the metric movements, in this case, might not be trustworthy because we did not expect that a feature that has an extremely low engagement to have such a large effect on user satisfaction. A quick initial analysis of the experiment did not reveal any glaring issues and the team wanted to make a ship decision in a timely manner due to business reasons. What is the best guidance to provide the team in such situations, where there aren’t any obvious issues with the A/B test but we strongly believe that the results are not trustworthy? We made the decision to re-run the experiment with a set of re-randomized users and with higher traffic. The second experiment came out flat on almost all user engagement metrics, as expected, and the team decided to ship the change.
The ultimate test for a treatment effect detected in an A/B experiment is reproducibility. Rerunning an A/B test (on a resampled set of users) and observing a comparable treatment effect greatly increases our confidence that the treatment effect is real. When in doubt, we re-run.
Regularly Share Experiment Results
One of the main steps in the A/B testing flywheel is sharing the results widely within the organization. It accelerates the adoption of experimentation by creating a culture where teams learn from A/B tests results and the ship decision made. This transparency and openness promote a growth mindset, particularly when the decision is to iterate on a change before shipping it.
There are many ways of sharing experimentation results across a team. Some teams hold regular reviews where experimenters bring in their A/B test results to discuss the observed metric movements to validate or negate the hypothesis. This is a great way to educate new people about A/B testing, share learnings and insights from earlier similar hypotheses, and have experts in A/B testing verify the trustworthiness of the results. Another way to advertise experiment results is to include them in every “ship” email. These are emails that are sent to larger teams announcing new features added and new changes released to the product. By including the A/B test results behind these releases, we create a culture where every change goes through an A/B test before it is released to verify and quantify the impact on the user.
At Microsoft, we frequently organize Best Experiments Talks where A/B tests with valuable learnings are presented company-wide to inspire and spark interest in data-driven decisions. This has led to cross-pollination and experimentation growth as product teams can apply findings and insights from others to their experimentation programs.
Archive Hypothesis, Tests, and Metric Movements
Hypotheses tested through A/B experiments offer a trove of information that product teams can learn from. Collecting the hypothesis, A/B test metadata, and metric movements observed provides a living history of feature ideas, changes, and releases the team tested and their resulting outcomes. With that history, the team can return to earlier hypotheses to make more informed decisions regarding the development of future ideas. We can perform meta-analysis to correlate the type of hypotheses with specific metric movements, study how metrics move across tests, and identify the most impactful tests on key metrics like OECs and Guardrails. In fact, a library of hypotheses can also serve as an Experiment Corpus to properly evaluate and detect flaws in your metrics [10]. This produces more trustworthy metrics that would increase the value of your future experiments.
One other reason to archive A/B tests and their metric movements across the organization is to provide transparency about all changes shipped that could impact a key metric. Consider, for example, the situation where a product team ships a change that increases user satisfaction but hurts the page load time. A few weeks later, the Performance team notices an increase in the page load time and decides to unship that change to improve page load time. At the end of the day, there was no impact on the product, but each team is under the impression that they improved their own OEC. Having a central location visible to all teams, where shipped changes are recorded along with their impact on key metrics avoids this vicious cycle of shipping and unshipping the same or similar changes.
Summary
The patterns that we covered in this blog post (as well as our earlier posts) help us to achieve trustworthy results from A/B tests and to make well-informed ship decisions. Moreover, we can advance our understanding of user behavior and the product through a more trustworthy experimentation program. This leads to more adoption of A/B testing by product teams and accelerates innovation by testing changes reliably and quickly.
So go ahead, experiment, be trustworthy, and improve your product!
– Widad Machmouchi and Somit Gupta, Microsoft Experimentation Platform
References
[1] P. Dmitriev, S. Gupta, D. W. Kim, and G. Vaz, “A Dirty Dozen: Twelve common metric interpretation pitfalls in online controlled experiments,” in Proceedings of the ACM SIGKDD International Conference on Knowledge Discovery and Data Mining, 2017, vol. Part F1296, pp. 1427–1436, doi: 10.1145/3097983.3098024.
[2] W. Machmouchi and G. Buscher, “Principles for the design of online A/B metrics,” SIGIR 2016 – Proc. 39th Int. ACM SIGIR Conf. Res. Dev. Inf. Retr., pp. 589–590, 2016, doi: 10.1145/2911451.2926731.
[3] P. Dmitriev, S. Gupta, D. W. Kim, and G. Vaz, “A Dirty Dozen: Twelve Common Metric Interpretation Pitfalls in Online Controlled Experiments,” in Proceedings of the 23rd ACM SIGKDD International Conference on Knowledge Discovery and Data Mining, 2017, pp. 1427–1436.
[4] R. Kohavi et al., “Controlled experiments on the web: survey and practical guide,” Data Min Knowl Disc, vol. 18, pp. 140–181, 2009, doi: 10.1007/s10618-008-0114-1.
[5] A. Deng and V. Hu, “Diluted treatment effect estimation for trigger analysis in online controlled experiments,” WSDM 2015 – Proc. 8th ACM Int. Conf. Web Search Data Min., pp. 349–358, 2015, doi: 10.1145/2684822.2685307.
[6] A. Fabijan et al., “Diagnosing sample ratio mismatch in online controlled experiments: A taxonomy and rules of thumb for practitioners,” Proc. ACM SIGKDD Int. Conf. Knowl. Discov. Data Min., pp. 2156–2164, 2019, doi: 10.1145/3292500.3330722.
[7] S. Gupta, R. Kohavi, D. Tang, and Y. Xu, “Top Challenges from the first Practical Online Controlled Experiments Summit,” ACM SIGKDD Explor. Newsl., vol. 21, no. 1, pp. 20–35, 2019, doi: 10.1145/3331651.3331655.
[8] R. Kohavi, “Twyman’s Law.” .
[9] A. Gelman and J. Carlin, “Beyond Power Calculations: Assessing Type S (Sign) and Type M (Magnitude) Errors,” Perspect. Psychol. Sci., vol. 9, no. 6, pp. 641–651, 2014, doi: 10.1177/1745691614551642.
[10] P. Dmitriev and X. Wu, “Measuring Metrics,” in Proceedings of the 25th ACM International on Conference on Information and Knowledge Management – CIKM ’16, 2016, pp. 429–437, doi: 10.1145/2983323.2983356.