

Taking a look into the graph
In our final post for this series, we are going to talk about Microsoft Academic Graph (MAG) analytics. The MAG’s vast amount of data is structured in a way that allows you to gain interesting perspectives on how, where, and by whom research is done. To expose our users to the powerful insights provided by MAG, we have created analytics pages on the Microsoft Academic website and which focus on each primary ‘entity’ in our graph: Publications, Topics, Authors, Institutions, Journals, and Conferences. If you are interested in the data that powers Microsoft Academic, to generate your own analytics and insights, it is freely available upon request (opens in new tab).
Front and center, always current
Our team regularly releases new versions of the graph and these updates are published to the Microsoft Academic website when they are available. On our homepage, we show the current counts of each primary entity type in a summary panel:

As of this writing, we have gathered nearly 219 million publications of research in our graph. Clicking on an entity type in this summary panel will take you to useful analytics for that entity.
Also, on the homepage under the search bar, there is a section that highlights some of our analytics work. We have pulled together the highest trending topics across our graph, as well as the top-ranked authors and institutions. Clicking on “Explore” beneath these charts will take you to dedicated analytics pages for Authors or Institutions.
Publication Analytics
At the heart of our graph are the research publications. If you click on “papers” in the summary panel on the home page, you will be taken to our Publication Analytics page:

Here, you can see the distribution of publication types and publishing trends over time. By selecting a topic from the topic browser, you can focus on the area you care about most. As you dive into topics of interest, we also show author, institution, journal, and conference rankings.
Speaking of topics, let’s follow the link at the bottom the page to the Topics Analytics page by clicking on “Topics” in the “Explore more” bar.
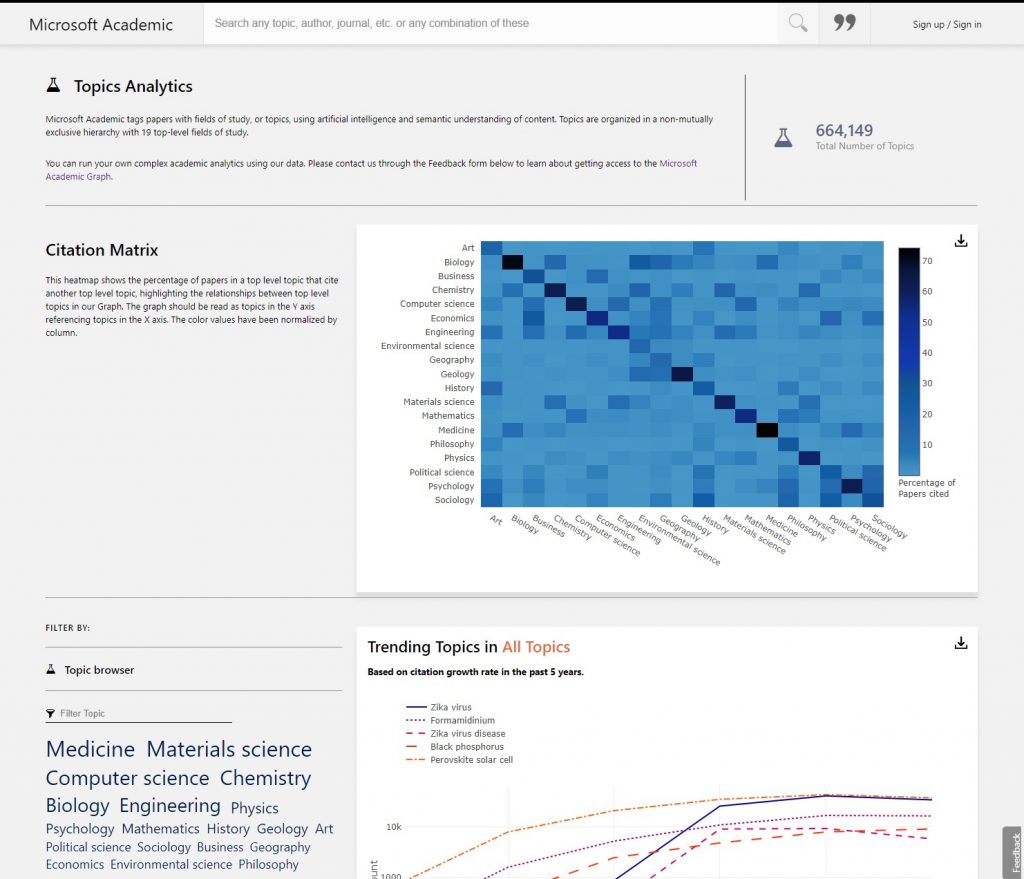
The Topics Analytics page has information about topics in our graph. At the top, there is a citation matrix of our top-level topics and this graph shows the relationship between each of them. Here, we show how research in different areas relate to each other. Further down the page, you can navigate through the topic hierarchy to find research trends in topics you care about. There are seven levels to this hierarchy, which contains more than 650,000 topics. We display the hierarchy in the topic browser control and when you are browsing the Microsoft Academic website. For instance, searching for a topic in the search bar will add a card to the right of the search results. When you click here, you will be taken to the topic’s detail page. On this page you will see parent, child, and related topics:

Rankings
Institution, Journal, and Author analytics pages focus primarily on rankings. Visiting the Institutions Analytics page (opens in new tab) will give you institution rankings, based on topic. As an example, the image below shows the top 100 institutions, based on salience for “Image processing (opens in new tab).” Each of the institutions in the list can be clicked to see detailed information on the publications and authors for that institution.

We realize that there is more than one way to rank, so we provide links to sort on Salience (opens in new tab), Prestige (opens in new tab), citation count, publication count, and h-index. Each sort can then be filtered by a timespan of one, five, ten years, or all time. This can be helpful to find thought leaders for a given topic. For information about Salience and Prestige ranking, see our FAQ (opens in new tab).
Author, Journal, and Conference analytics pages will provide you with a similar experience and opportunities for insight. Our User Experience team will continue to surface new and valuable insights the Graph can provide.
Thanks for reading
This concludes our blog series announcing the most recent set of improvements we have made to the Microsoft Academic website. We hope that the changes improve your experience. We will continue to make improvements and announce them here. If you have suggestions or issues, please use the feedback tool on the site to let us know.