

Infographic Designer
Established: March 1, 2016
Infographic visualizations are getting increasingly popular, and have been widely adopted in the real world. As research reveals, they can improve the effectiveness of visualizations by making data quickly understood and easily remembered. However, current data visualization systems lack supports for generating infographics.
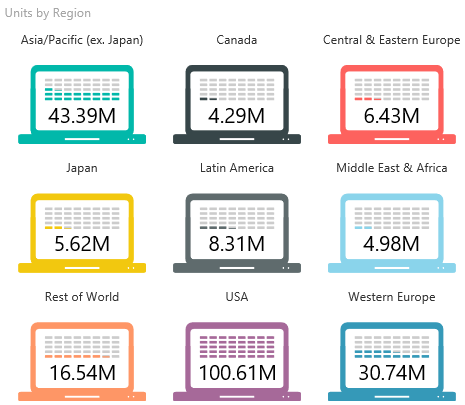
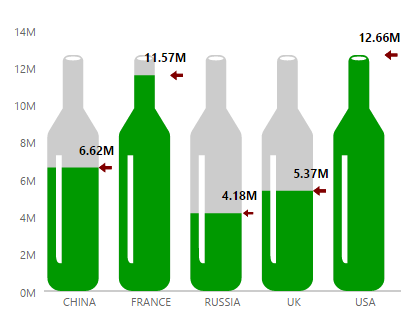
Infographic Designer (a.k.a. InfoNice), released as a Power BI custom visual, enables easy creation of infographic visualizations for business users. It provides an easy-to-use UI for users to customize chart marks with rich visual elements, including icons, images, and texts. With Infographic Designer, users can turn a standard column chart or bar chart into a more compelling and customized infographic presentation of data, which makes their dashboards and reports much more beautiful, readable, and friendly.
Power BI blog on Infographic Designer (opens in new tab)
Please let us know your feedback. Send us email: infonice@microsoft.com
See more in the Gallery.
Download Infographic Designer
Go to Power BI Custom Visuals Gallery (opens in new tab), select Infographic Designer from the visuals list.
Get Started with Infographic Designer
Acknowledgement Thanks Sirui Tan, our designer intern, for working on the icon library, and contributing to the graphical design as well as user experience design of Infographic Designer.
People
Ray Huang
Research SDE
Haidong Zhang
Principal Architect
Qiufeng Yin
PRINCIPAL DEV MANAGER
Zhitao Hou
SR PRINCIPAL RESEARCHER
Dongmei Zhang
Distinguished Scientist, Deputy Managing Director, Microsoft Research Asia
Yun Wang
Senior Researcher