
The Single Cell Network Synthesis tool (SCNS) is a tool for the reconstruction and analysis of executable models from single-cell gene expression data, which supports easy deployment of computation to the cloud for performance and control via a web-based graphical interface. SCNS can be used for understanding differentiation, developmental, or reprogramming journeys.
SCNS takes single-cell qRNA or RNA-sequencing data, and treats expression profiles as binary states, where a value of 1 indicates a gene is expressed and 0 indicates that it is not. It then constructs a state transition graph, where pairs of states are connected by an edge if they differ in the expression of exactly one gene. This data the basis to reconstruct Boolean logical regulatory rules, by searching for rules that drive transitions from early cell states towards late cell states. Because the resulting models are executable, they can be used to make predictions about the effect of specific gene perturbations on the generation of specific lineages, to suggest strategies for improving reprogramming efficiency, or to introduce cancer-associated mutations and pinpoint interventions that revert the model to a wild-type state.
We have previously applied SCNS to understand the earliest development of blood in the mouse embryo [1].
Download
Windows installer. A modern browser such as Edge, Chrome or Firefox as your default browser is recommended.
For data sets of up to a few thousand cells, SCNS can typically reconstruct a Boolean network model on your desktop machine within minutes. For larger data sets, configuring SCNS to deploy computation to your Azure cloud account may be desirable.
Running in the cloud via Azure
To run on your Azure account, go to https://manage.windowsazure.com/publishsettings and download your publishsettings file. Save this as a file called azure.publishsettings and put in the SCNS installation folder. Then, after starting SCNS go to the config page and select “Run in cloud”.
The first time you start up SCNS after saving your publishsettings file you will need to give the tool a few minutes to set up a cluster on your Azure account.
Toy common myeloid progenitor example
Reconstruct the asynchronous Boolean network from Hierarchical Differentiation of Myeloid Progenitors Is Encoded in the Transcription Factor Network [2] from its state space.
Parameters used: Initial cells = initial, Target cells = nonInitial, Cebpa = (1, 2, 100), EKLF = (1, 1, 100), EgrNab = (2, 1, 100), Fli1 = (1, 1, 100), Fog1 = (1, 0, 100), Gata1 = (2, 1, 100), Gata2 = (1, 2, 100), Gfi1 = (1, 1, 100), Pu.1 = (1, 1, 100), Scl = (1, 1, 100), cJun = (1, 0, 100).
Application to human preimplantation embryo data
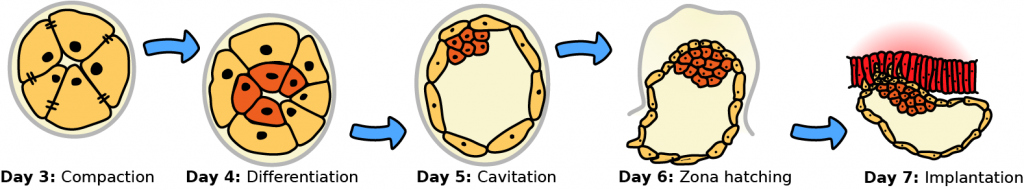
Day 3 to 7 humanpreimplantation development. Adapted from https://en.wikipedia.org/wiki/File:HumanEmbryogenesis.svg. This file is licensed under the Creative Commons Attribution-Share Alike 3.0 Unported license.
We applied SCNS to a recently published single-cell RNA-seq data set consisting of 1529 cells from 88 human embryos, from day 3 to day 7 of preimplantation development [3]. We obtained a core regulatory network of 9 transcription factors.
Parameters used: Initial cells = E3, Target cells = E7_target, ARGFX = (2, 0, 70), CDX2 = (3, 0, 70), DLX5 = (1, 0, 80), GATA2 = (1, 0, 90), GATA3 = (1, 0, 90), GATA4 = (1, 0, 80), GATA6 = (1, 0, 80), GCM1 = (2, 0, 70), HAND1 = (1, 2, 70), HNF1B = (1, 0, 80), HNF4A = (1, 2, 60), KLF17 = (1, 1, 80), LBH = (1, 0, 70), NANOG = (1, 0, 70), OVOL1 = (1, 0, 100), POU5F1 = (2, 0, 80), PRDM14 = (1, 1, 60), PRDM16 = (1, 0, 10), SOX17 = (2, 0, 70), SOX2 = (3, 0, 80).
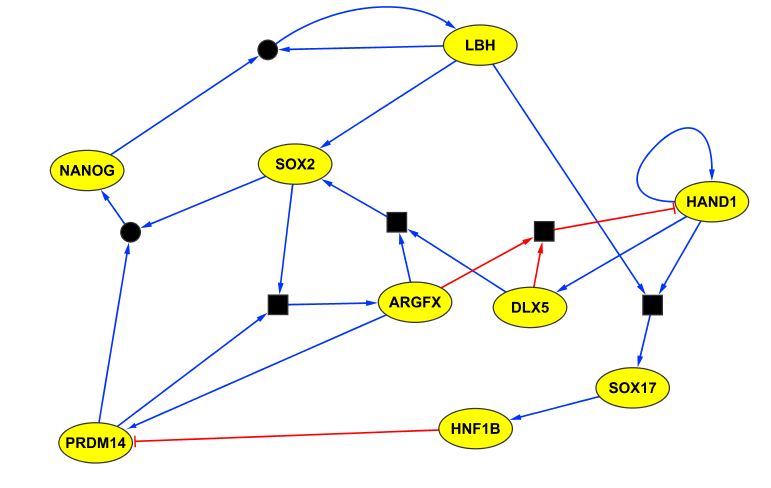
Extracted regulatory network for human preimplantation development. Blue edges indicate activation; red edges indicate repression. Square boxes represent AND operations. Circles connecting edges indicate multiple compatible update rules.
References
- Moignard, V. et al. Decoding the regulatory network of early blood development from single-cell gene expression measurements. Nature biotechnology. 33, 269-276 (2015).
- Krumsiek, J. et al. Hierarchical Differentiation of Myeloid Progenitors Is Encoded in the Transcription Factor Network. PLOS ONE. 6 (2011).
- Petropoulos, S. et al. Single-Cell RNA-Seq Reveals Lineage and X Chromosome Dynamics in Human Preimplantation Embryos. Cell. 5, 1012-26 (2016).