

This page explores algorithms, interfaces and prototypes we developed over the years for visualizing and interacting with complex networks.
Interactive Visual Exploration of Dynamic Networks
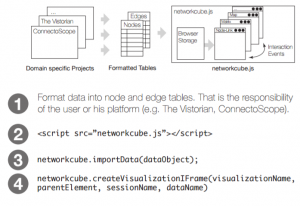 NetworkCube is a platform for network visualization, with a focus on dynamic networks. It is a javascript library that provides: data import, a dynamic graph API, network visualizations and components, messages that synchronize views after user interaction, and, general functionalities, such as history, brushing+linking, search, coloring. NetworkCube runs locally in a browser; user data is stored solely in the browser’s local storage. Messages keep views coordinated across iframes, tabs, and even windows.
NetworkCube is a javascript library hosted on Github. Use it & contribute (opens in new tab)!
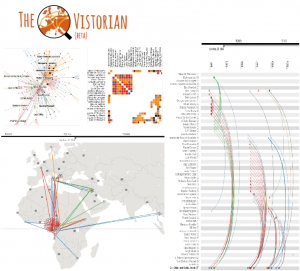
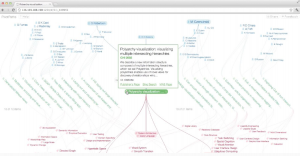
The Vistorian is a visualization platform for historians built with NetworkCube. Analysts can map their data tables to a network structure online, by defining columns for source and target node, edge type, and time; then visualizing their data using node-link diagrams, adjacency matrices, map and a dynamic ego-network visualization, each in separate tabs. Tabs are connected by brushing+linking, and colored selections.
Try it at vistorian.net (opens in new tab)
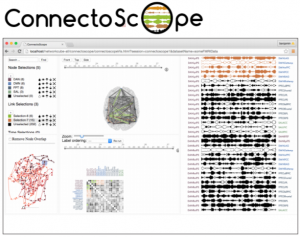 ConnectoScope is a visualization platform for brain connectivity in neuroscience built with NetworkCube. ConnectoScope allows exploring fMRI data from a neuroscience standard format. Brain connectivity networks are automatically extracted from fMRI files and visualized using a 3D glass brain visualization, adjacency matrices, and LinkWave. Views are connected by brushing+linking, and colored selections.
Try it at connectoscope.azurewebsites.net (opens in new tab)
More research on visualizing brain connectivity (opens in new tab)
Interactive Visual Exploration Leveraging Search & Browsing
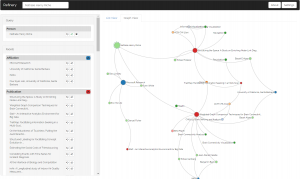 Refinery is an interactive visualization for exploring multivariate graphs leveraging associative browsing. Refinery explores a new strategy for bottom-up exploration of large, heterogeneous networks. The query model allows users to simply and expressively construct queries by rating nodes up or down. The system computes the degree-of-interest scores for associated content using a fast, random-walk algorithm. Refinery then visualizes query nodes within a subgraph of results, providing explanatory context, facilitating serendipitous discovery, and stimulating continued exploration.
Try Refinery online (opens in new tab) on publication data (start by searching for “Microsoft” for example).
 PivotPaths is an interactive visualization for exploring faceted information resources. During both work and leisure, we increasingly interact with information spaces that contain multiple facets and relations, such as authors, keywords, and citations of academic publications, or actors and genres of movies. To navigate these interlinked resources today, one typically selects items from facet lists resulting in abrupt changes from one subset of data to another. While filtering is useful to retrieve results matching specific criteria, it can be difficult to see how facets and items relate and to comprehend the effect of filter operations. In contrast, the PivotPaths interface exposes faceted relations as visual paths in arrangements that invite the viewer to ‘take a stroll’ through an information space. PivotPaths supports pivot operations as lightweight interaction techniques that trigger gradual transitions between views. We designed the interface to allow for casual traversal of large collections in an aesthetically pleasing manner that encourages exploration and serendipitous discoveries.
Try PivotPaths online (opens in new tab)
Interactive Visual Exploration with Matrix-Based Representations
 MultiPiles (opens in new tab) is an interactive visualization interface to explore time-series of dense and weighted networks. MultiPiles is based on the physical analogy of piling adjacency matrices, each one representing a single temporal snapshot. Common interfaces for visualizing dynamic networks use techniques such as: flipping/animation; small multiples; or summary views in isolation. Our proposed ‘piling’ metaphor presents a hybrid of these techniques, leveraging each one’s advantages, as well as offering the ability to scale to networks with hundreds of temporal snapshots.
Try the online demo (opens in new tab)
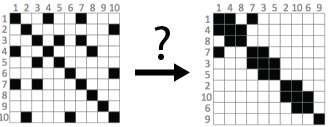 This survey (opens in new tab) provides a description of algorithms to reorder visual matrices of tabular data and adjacency matrix of networks. The goal of this survey is to provide a comprehensive list of reordering algorithms published in different fields such as statistics, bioinformatics, or graph theory. While several of these algorithms are described in publications and others are available in software libraries and programs, there is little awareness of what is done across all fields. Our survey aims at describing these reordering algorithms in a unified manner to enable a wide audience to understand their differences and subtleties. We organize this corpus in a consistent manner, independently of the application or research field. We also provide practical guidance on how to select appropriate algorithms depending on the structure and size of the matrix to reorder, and point to implementations when available.
Tell Stories about Dynamic Networks with Graph Comics
Visit graphcomics online (opens in new tab). Read a comic on data comics (opens in new tab)
Interaction & Algorithms for Edge Compression and Bundling
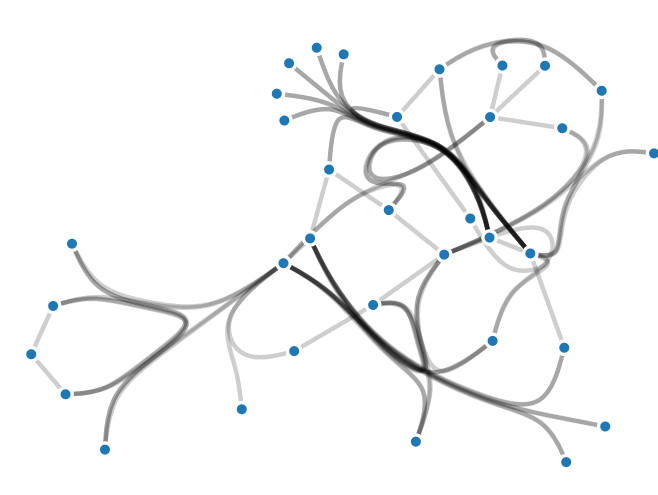 Confluent Drawing is a technique for bundling edges in node-link diagrams based on network connectivity. Edge-bundling techniques are designed to reduce edge clutter in node-link diagrams by coalescing lines into common paths or bundles. Unfortunately, traditional bundling techniques introduce ambiguity since edges are only bundled by spatial proximity, rather than network connectivity; following an edge from its source to its target can lead to the perception of incorrect connectivity if edges are not clearly separated within the bundles. Contrary, confluent drawing bundles edges based on common sources or targets. Thus, a smooth path along a confluent bundle indicates precise connectivity. See more examples (opens in new tab) and try the technique online (opens in new tab)
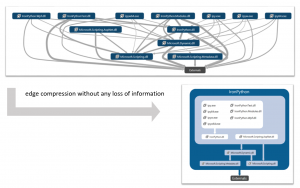 We explore the effectiveness of visualizing dense directed graphs by replacing individual edges with edges connected to “modules”—or groups of nodes—such that the new edges imply aggregate connectivity. We only consider techniques that offer a lossless compression: that is, where the entire graph can still be read from the compressed version. The techniques considered are: a simple grouping of nodes with identical neighbor sets; Modular Decomposition which permits internal structure in modules and allows them to be nested; and Power Graph Analysis which further allows edges to cross module boundaries. These techniques all have the same goal—to compress the set of edges that need to be rendered to fully convey connectivity—but each successive relaxation of the module definition permits fewer edges to be drawn in the rendered graph. User studies we conducted indicate that people can accurately decode these compressed diagrams, even in most extreme cases of compression. More details here
Algorithms for Visualizing Overlapping Sets and Clusters
 In many common data analysis scenarios the data elements are logically grouped into sets. Venn and Euler style diagrams are a common visual representation of such set membership where the data elements are represented by labels or glyphs and sets are indicated by boundaries surrounding their members. Generating such diagrams automatically such that set regions do not intersect unless the corresponding sets have a non-empty intersection is a difficult problem. Further, it may be impossible in some cases if regions are required to be continuous and convex. Several approaches exist to
draw such set regions using more complex shapes, however, the resulting diagrams can be difficult to interpret. We investigate novel approaches for simplifying a complex collection of intersecting sets into a strict hierarchy that can be more easily automatically arranged and drawn.
More details on leveraging hierarchical nesting and using lines to represent sets.