
STOCK PRICE INFORMATION AND ISSUER PURCHASES OF EQUITY SECURITIES
Our common stock is traded on The NASDAQ Stock Market under the symbol MSFT. On July 28, 2008, there were 145,903 registered holders of record of our common stock. The high and low common stock sales prices per share were as follows:
| Quarter Ended | Sep 30 | Dec 31 | Mar 31 | June 30 | Year |
|---|---|---|---|---|---|
| Fiscal year 2008 | |||||
| Common stock price per share: | |||||
| High | $31.84 | $37.50 | $35.96 | $32.10 | $37.50 |
| Low | 27.51 | 29.29 | 26.87 | 27.11 | 26.87 |
| Fiscal year 2007 | |||||
| Common stock price per share: | |||||
| High | $27.52 | $30.26 | $31.48 | $31.16 | $31.48 |
| Low | 22.23 | 27.15 | 26.60 | 27.56 | 22.23 |
See Note 16 – Stockholders’ Equity of the Notes to Financial Statements for information regarding dividends approved by our Board of Directors in fiscal years 2008 and 2007.
On July 20, 2006, we announced that our Board of Directors authorized two new share repurchase programs: a $20 billion tender offer which was completed on August 17, 2006; and authorization for up to an additional $20 billion ongoing share repurchase program that expires on June 30, 2011. Under the tender offer, we repurchased approximately 155 million shares of common stock, or 1.5% of our common shares outstanding, for approximately $3.8 billion at a price per share of $24.75. On August 18, 2006, we announced that the authorization for the $20 billion ongoing share repurchase program had been increased by approximately $16.2 billion. As a result, we were authorized to repurchase additional shares in an amount up to $36.2 billion through June 30, 2011. The repurchase program may be suspended or discontinued at any time without prior notice. The transactions occurred in open market purchases and pursuant to a trading plan under Rule 10b5-1. We repurchased common stock in each quarter of fiscal year 2008 using available cash resources as follows:
| Period | Total number of shares purchased | Average price paid per share |
|---|---|---|
| July 1, 2007 – September 30, 2007 | 80,597,986 | $29.14 |
| October 1, 2007 – December 31, 2007 | 119,614,762 | $34.12 |
| January 1, 2008 – March 31, 2008 | 30,160,464 | $33.82 |
| April 1, 2008 – June 30, 2008 | 171,474,350 | $29.01 |
| Total share repurchases in fiscal year 2008 | 401,847,562 |
Common stock repurchases in the fourth quarter of fiscal year 2008 were as follows:
| Period | (a) Total number of shares purchased | (b) Average price paid per share | (c) Total number of shares purchased as part of publicly announced plans or programs | (d) Approximate dollar value of shares that may yet be purchased under the plans or programs (in millions) |
|---|---|---|---|---|
| April 1, 2008 – April 30, 2008 |
– | $ | – | $7,688 |
| May 1, 2008 – May 31, 2008 |
82,151,000 | $29.77 | 82,151,000 | $5,243 |
| June 1, 2008 – June 30, 2008 |
89,323,350 | $28.31 | 89,323,350 | $2,714 |
| 171,474,350 | 171,474,350 |
COMPARISON OF 5 YEAR CUMULATIVE TOTAL RETURN*
Among Microsoft Corporation, The S&P 500 Index
And The NASDAQ Computer Index
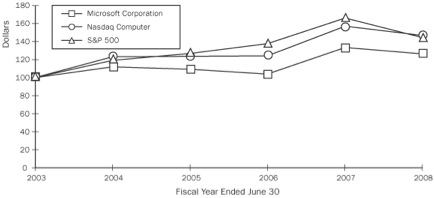
| Total Cumulative Return* |
| 6/03 | 6/04 | 6/05 | 6/06 | 6/07 | 6/08 | |
|---|---|---|---|---|---|---|
| Microsoft Corporation | 100.00 | 112.00 | 109.36 | 103.93 | 133.27 | 126.20 |
| S&P 500 | 100.00 | 119.11 | 126.64 | 137.57 | 165.90 | 144.13 |
| NASDAQ Computer | 100.00 | 123.02 | 123.58 | 124.06 | 157.04 | 146.54 |
* $100 invested on 6/30/03 in stock or index-including reinvestment of dividends.